Summary
Broader Industrial data have gotten resoundingly stronger since May. Since the 2009 recovery, most measures of U.S. industrial growth had shown a relatively steady deceleration. Recent data appear to break that trend. As always, industry specific data vary.
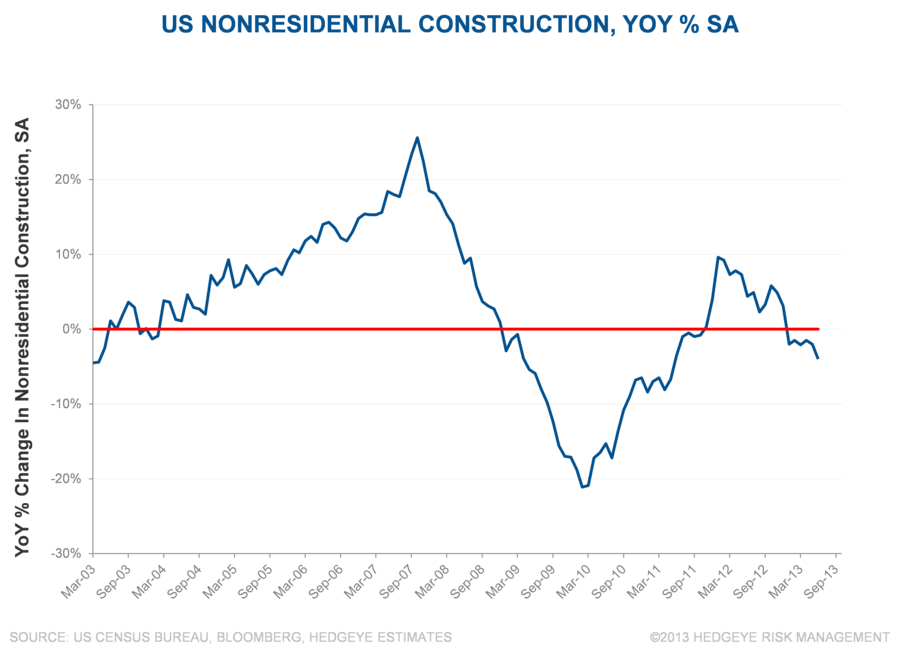
- Nonresidential construction has been notably weak, but the Architectural Billings Index suggests that we should see a rebound in coming months.
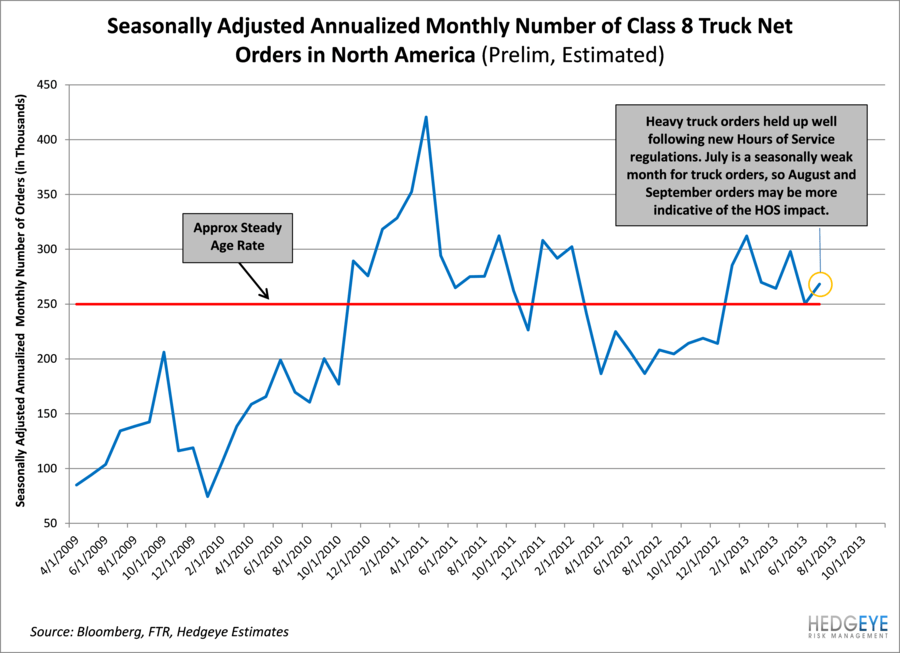
- North American Heavy Truck orders (preliminary) in July do not show much impact from new Hours of Service regulations.
- Intermodal rail carload growth appears likely to follow the ISM New Orders index higher in coming weeks.
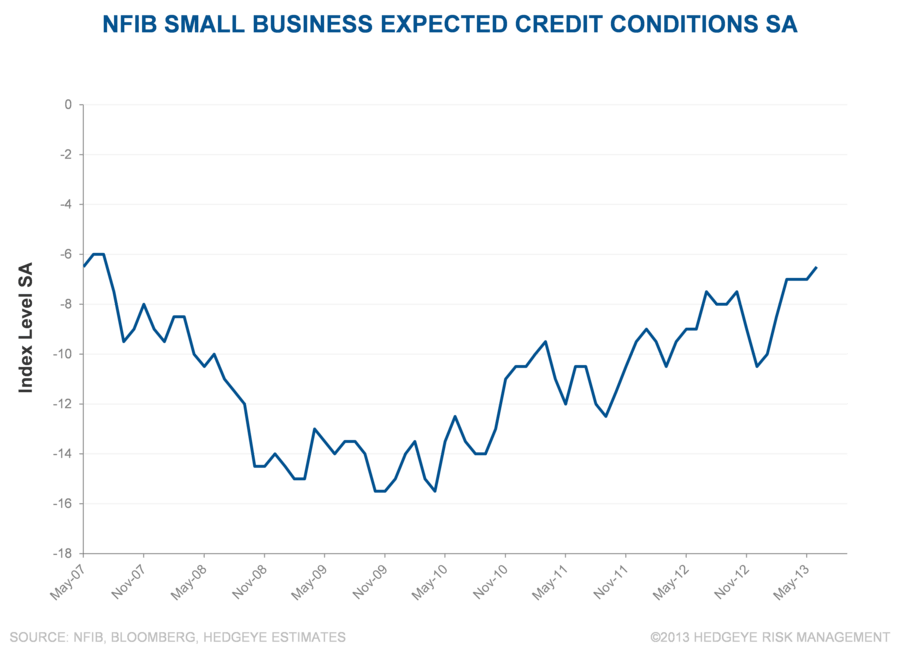
- Fastenal’s Average Daily Sales have continued to decelerate through July, while small business credit conditions have continued to ease.
ISM New Orders
The rebound in new order activity in both the Manufacturing and Non-Manufacturing ISM indices appears to be a meaningful breakout. However, these measures also spiked higher in February 2013, only to fade in the following months. Nonetheless, strength in this measure is an encouraging sign amid recent stall-speed industrial activity.

Durable Goods Orders
The February 2013 spike in the ISM Manufacturing New Orders sub-index was not well reflected in several other measures of industrial order activity, including Durable Goods Orders. The coinciding upward move in July Durable Goods Orders provides support for the higher ISM New Orders reading.

Heavy Truck Orders
Preliminary North American Class 8 truck orders were relatively tame in July. A potential decline in truck demand from new Hours of Service (HOS) regulations, which became effective July 1, could set-up a buying opportunity for high quality truck OEMs, like PCAR. We will monitor the next few months, which are seasonally higher volume than July, for any HOS-related weakness/opportunity.
Nonresidential Construction
A notable pocket of weakness has been nonresidential construction. The weakness is in part due to reduced government spending and a slow recovery in certain commercial real estate markets. Nonresidential construction tends to be ‘late cycle’ and may pick-up later this year.
Architectural Billings Index (ABI)
The ABI only turned slightly positive in August of 2012 and typically leads non-residential construction activity by 9-12 months. If the index performs as a leading indicator in the current environment, nonresidential construction should strengthen through the back half of 2013.

Residential Home Improvement Spending
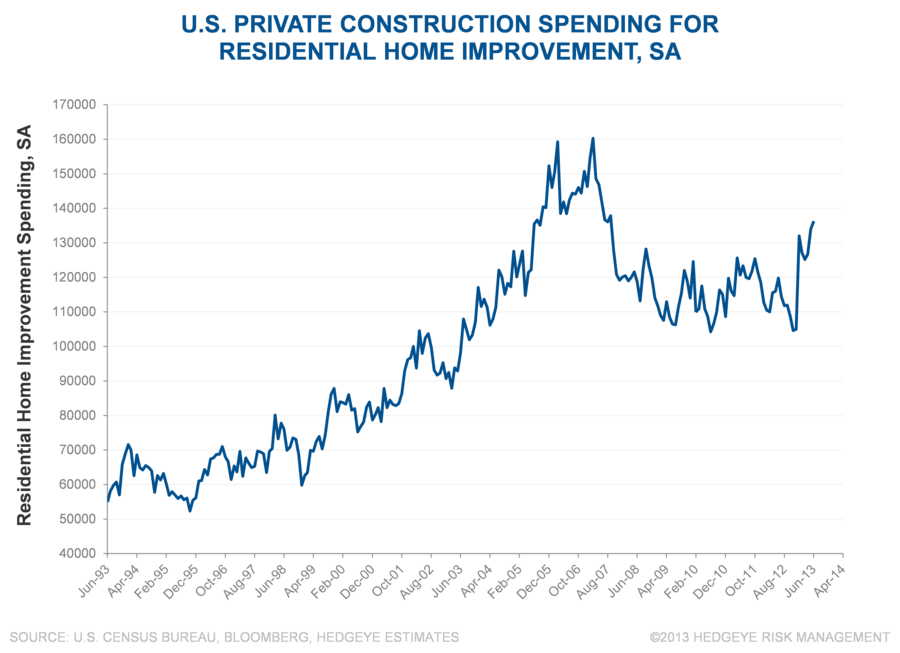
In contrast to nonresidential, construction spending on residential home improvement continues to spike higher, following a long period of stagnation after the housing bust.
Fastenal Average Daily Sales
Fastenal’s average daily sales growth has continued to decelerate, failing to reflect the bounce in the ISM or Durable Goods measures. While that could just be a lag between industrial orders and FAST sales, we think that easing credit conditions have been and will remain an important headwind.

NFIB Credit Conditions
Business credit continues to ease. Industrial supply companies served as an attractive source of working capital during the tight credit conditions following the financial crisis. As credit conditions thaw, industrial supply companies may see that tailwind turn into a growth headwind.
Intermodal Rail Carload Growth
Intermodal Rail Carload growth has not yet reflected recent strength in the ISM and Durable Goods new orders readings. Looking at the historical relationship between new orders and intermodal rail volumes, we would expect to see a pick-up in coming weeks.

