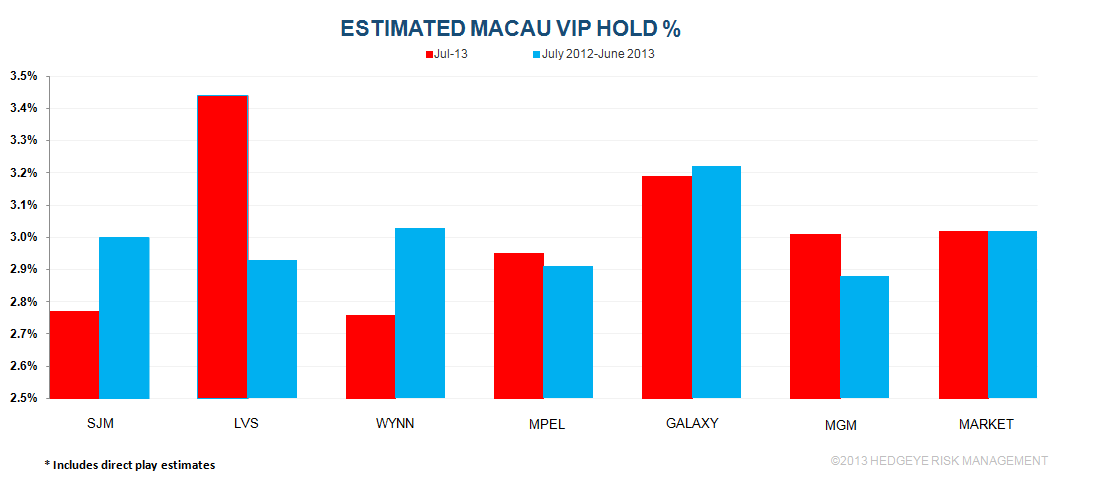
July GGR grew 20% YoY to HK$28.63 billion (US$ 3.69 billion). Volumes were the driver of the strength and all segments performed well. Mass, VIP, and slot revenues increased 32%, 16%, and 11%, respectively. VIP hold percentage was normal versus slightly below normal hold percentage in July 2012. We estimate that including direct play, VIP hold was 3.02% versus a normalized 3.00%. With normal VIP hold in both periods, GGR growth would have been 17%.
Here is the detail:
YOY TABLE OBSERVATIONS
Total table revenue grew 20% YoY. Mass market growth continued its streak of around 30% growth rate, up 32% in July. VIP volume rose 12% while VIP revenue gained 16%.
LVS
Table win grew 28%, lead by 96% growth at SCC. Mass revs remained strong at 43% while VIP RC grew 15%. Including direct play, we estimate that LVS held at 3.4% in July compared to 3.3% last July, assuming direct play of 16% vs. 22% last year.
- Sands climbed 9%
- Mass grew a meager 3%, lowest growth since August 2012
- VIP revenue rose 15%
- Sands held at 3.4% vs 2.8% in the same period last year. We assume 10% direct play in July vs 8% in July 2012.
- Junket RC fell 9%
- Venetian grew 7%
- Mass increased 21%
- VIP revenue fell 5%
- Junket VIP RC gained 8%
- Assuming 28% direct play, hold was 3.3% compared to 3.7% in July 2012, assuming 30% direct play
- Four Seasons gained 14%
- Mass revenue gained 30%
- VIP revenue grew 11% but Junket VIP RC declined 10%. July hold (assuming 15% direct play) was 3.7% vs 3.0% in July 2012 when direct play was 16%.
- Sands Cotai Central rocketed 96% higher
- Mass jumped 183% to $104MM, a new monthly high
- VIP revenues grew 63%
- Junket RC volume of $4.3BN, up 64% YoY
- If we assume that direct play was 10%, hold would have been 3.4%
MPEL
MPEL gained 20% in table revenues. Mass continued to be white-hot at 58% (1st in the market) while VIP growth was 7%. We estimate that MPEL held at 3.0% vs 2.9% last July. Estimated direct play was 10%, in-line with last year.
- Altira table revenues grew 4%. Mass and VIP both rose 4%
- VIP RC declined 1%
- We estimate that hold was 2.7%, compared to 2.5% in the prior year
- CoD table revenues grew 26% YoY
- Mass increased 67%, continuing its impressive streak of strong YoY double-digit gains since the property opened
- VIP win grew 8% and RC grew 10%
- Assuming a 14% direct play level, hold was 3.1% in July compared to 3.1% last year (assuming 15% direct play)
WYNN
Wynn table revenues grew 8%, the worst performer in the market
- VIP revenues grew 3%, while VIP RC increased 9%
- Wynn held at 2.8% (assuming direct play of 8%) vs 2.8% last July (assuming direct play of 10%)
- Mass revenues gained 29%
MGM
MGM had the strongest performance in July, growing 32% in table revenues.
- We estimate that hold was 3.0% adjusted for direct play of 7% vs hold of 2.6% last year assuming 8% direct play
- VIP RC and Mass grew 15% and 32%, respectively
GALAXY
Galaxy table revenues increased 26%. VIP revenues gained 22% while RC volumes grew 8%. On the bright side, Mass growth was strong at 40%. Hold was 3.2% in July 2013 vs. 2.9% last year.
- StarWorld table revenues rose 11%
- Mass soared 69%
- VIP gained 4%.
- Junket RC rose 7%
- Hold was 3.2% vs 2.9% last year
- Galaxy Macau's table revenues grew 43%
- Mass had another great month at 40% growth
- VIP rebounded strongly at 44% growth
- Hold was 3.4% vs 2.7% last July
SJM
Total table revenue grew 12%, with mass and VIP growth of 11% and 13%, respectively. RC volume gained 17%. SJM held at 2.8% vs 2.9% last year.
SEQUENTIAL MARKET SHARE - June to July (property specific details are for table share while company-wide statistics are calculated on total GGR, including slots):
LVS
Market share gained 240bps to 22.8%. July’s share is above its 6-month average of 21.0% and better than its 2012 average share of 19.0%.
- Sands' share was flat at 3.5%. For comparison purposes, 2012 share was 3.9% and 6M trailing average share was 3.2%.
- Mass share dropped 30bps to 5.1%
- VIP rev share was unchanged at 2.8%
- RC share was 2.3%, -10bps MoM
- Venetian’s share gained 20bps to 8.0%. 2012 share was 7.9% and 6 month trailing share was 8.3%.
- Mass share decreased 10bps to 13.4%
- VIP share was unchanged at 5.4%
- Junket RC share declined 20bps at 3.7%
- FS gained gained 130bps to 3.5%. This compares to 2012 share of 3.7% and 6M trailing average share of 2.9%.
- VIP was rocketed 170bps higher to 4.4%
- Mass share gained 70bps to 1.7%
- Junket RC gained 20bps to 3.2%
- Sands Cotai Central's table market share gained 110bps to 7.5%, which compares to the 6M trailing average share of 6.1%.
- Mass share fell 20bps to 9.2%, a new high
- VIP share climbed 150bps to 6.7%
- Junket RC share fell 30bps to 5.7%
MPEL
MPEL grew 60bps in share in July to 13.2%. Its 6 month trailing share is 14.3% and their 2012 share of 13.5%.
- Altira’s share fell 50bps to 3.3%, below its 6 month trailing and 2012 shares of 3.8%
- Mass share gained 10bps to 1.2%
- VIP lost 80bps to 4.2%
- VIP RC share gained 40bps to 4.9%
- CoD’s share fell 80bps to 9.8%, above the property’s 2012 and 6M trailing share of 9.4% and 10.3%, respectively.
- Mass market share slipped 10bps to 12.3%
- VIP share fell 120bps to 8.6%
- RC share dropped 100bps to 7.7%
WYNN
Wynn GGR share was 10.2%, flat MoM. 2012 average share was 11.9% and their 6M trailing average share has been 11.0%.
- Mass share was gained 140bps to 7.7%
- VIP share tumbled 70bps to 11.1%
- Junket RC share gained 10bps to 12.1%
MGM
MGM’s market share dropped the most among its peers - 150bps to 9.5%, below its 6M and 2012 average of 9.9%
- Mass share tumbled 140bps to 6.6%
- VIP share dropped 140bps to 10.5%
- Junket RC slipped 130bps to 10.4%
GALAXY
Galaxy's share gained 60bps to 19.9%, above its 2012 average and 6-month average share of 19.0% and 18.5%, respectively
- Galaxy Macau share improved 70bps to 11.6%
- Mass share lost 30bps to 10.3%
- VIP share improved 110bps to 12.2%
- RC share gained 90bps to 11.6%
- Starworld share was flat at 7.6%
- Mass share gained 50bps to 4.1%
- VIP share dropped 10bps to 9.2%
- RC share gained 90bps to 9.9%
SJM
SJM share lost 10bps to 24.4%, below their 2012 average of 26.7% and their 6M trailing average of 25.3%
- Mass market shares gained 10bps to 26.6%
- VIP share lost 10bps to 24.4%
- Junket RC share rose 60bps to 28.1%
Slot Revenue
Slot revenue grew 11% YoY to $154MM in June
- GALAXY had the best YoY growth at 33% to $21MM
- LVS grew 22% to $47MM
- MPEL gained 11% to $26MM
- MGM was flat at $25MM
- WYNN dropped 2% to $21MM
- SJM had the worst YoY slot performance, -5% to $14MM