I think our delta charts tell a story. Regional gaming began turning "less bad" in January/February and the stocks squeezed higher beginning in mid-March. While not necessarily deteriorating, trends have leveled out and are at a critical juncture. With the exception of Missouri (loss limit removal) and Illinois (lapping the smoking ban impact), the six month moving averages have flattened or even turned negative.

The macro environment suggests a potential turn for the worse. Gas prices are rising, the initial government stimulus has flooded the economy, and people for the most part have received their tax refunds, which were larger than normal. The key question in my mind is what happens to the savings rate. Yes, the rate already spiked to 4%, higher than it's been through most of the housing boom. However, 4% is still well below the pre-housing boom average of 8-10%. The wealth effect suggests that with housing prices down 25% nationally, savings rate may revert to more normalized levels, much to the detriment of consumer spending.
Regional gaming should be less susceptible to another consumer downturn than other consumer discretionary sectors (certainly more protected than Las Vegas), but will not emerge unscathed. Could we already be in the midst of a leg down? Tough to say, but current valuations are not exactly implying another downturn. As can be seen in the following chart TEV/LTM EBITDA multiples are in the middle of the historical range, although at levels higher than when we last saw gaming bond yields in double digit (1) territory.
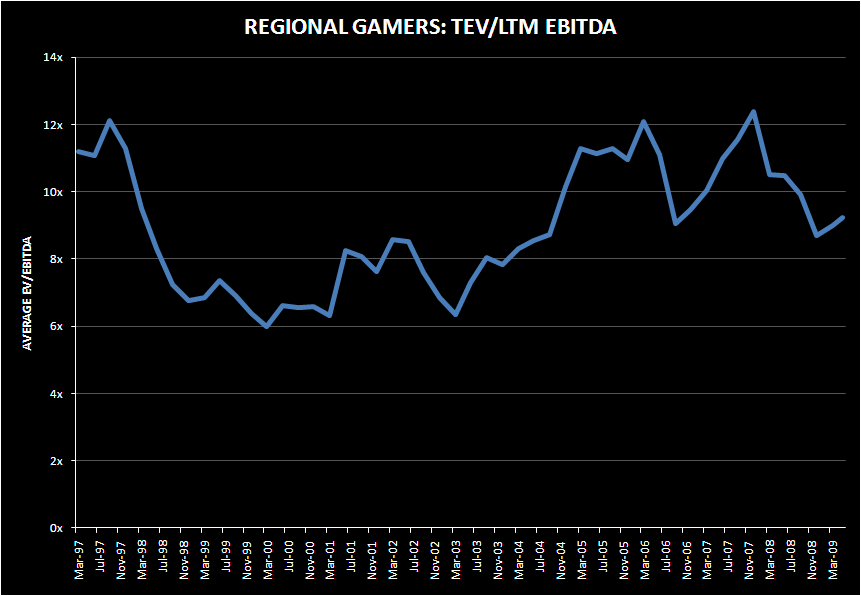
While trailing multiple is not our favorite metric, the data is instructive on relative historical basis, if not on an absolute basis. Forward EV/EBITDA multiples are in the 6.5x-7.0x range which, as we highlighted in our 4/20/09 note, "GAMING REGIONALS: THE FALLACY OF EV/EBITDA", is probably the right range given the higher cost of capital. Regional free cash flow yields remain in double digit territory, but low double digit, which is probably where they should be. BYD remains the standout with a FCF yield at 25% and the only "back up the truck" valuation.