Tie two rocks together and chuck 'em in the pond. Now do they float?
Key Points
- LINN and BRY have their own problems; the merger doesn’t solve them.
- With no material synergies, the all-stock merger makes little economic sense for either company.
- The deal is accretive for LINE unitholders on a DCF/unit basis primarily because LINN will understate maintenance capex on the BRY assets as it does its own.
- BRY is not cheap; in fact, we think fair value is ~$18 - $24/share. LINN is buying BRY at peak cash flows and earnings. Low multiples are warranted.
- BRY is a high cost producer facing margin headwinds, deteriorating capital efficiency, and slow growth, among other issues. We consider it a “structural short.”
- LINN is using overvalued equity to buy BRY’s overvalued equity.
- For now, we view BRY as a sell. If the merger falls apart, we would strongly consider a short position.
- LINN remains a short, regardless of whether the merger happens or not.
Summary
It’s popular opinion that LINN Energy’s (LINE, LNCO) pending merger with Berry Petroleum (BRY) is a silver bullet for LINN. We don’t see it that way. While consummating the transaction would repair damaged sentiment in the short-term, in particular in LINN’s growth-via-C-Corp-acquisition strategy, we believe that the BRY merger makes LINN’s fundamental problems worse, not better. Perversely, LINN will be a better short in the long-run if it merges with BRY (especially if it has to sweeten the deal terms) than if it doesn’t.
The core of LINN’s issue is that it does not generate the free cash flow needed to fund its distribution, and production growth has stalled such that its estimated maintenance capex (that amount of capex needed to hold production/reserves flat) is understated by ~$150MM per quarter – by our estimate – which is now the main source of distributable cash flow (DCF); reported DCF was $151MM in 1Q13. LINN also relies on irregular accounting with respect to its commodity derivatives book, and aggressive adjustments to non-GAAP measures, to generate DCF, as we have discussed previously, at length. LINN’s economic reality is that equity and debt raises fund the distribution; and management does its best to obscure it with the non-GAAP numbers.
What is LINN acquiring in BRY? In our view, it’s a marginal cost producer that is moving up the cost curve, with a reserve base that is dominated by high cost, low quality crude; uneconomic dry gas; and a lot of proved undeveloped reserves (45% of total). And LINN is attempting to acquire it during an ideal commodity price environment for BRY, which should not persist long. We believe that BRY’s cash flows and earnings are near peak levels today, and low multiples are justified. BRY is not cheap; we believe fair value is $18 - $24/share.
In our view, the merger makes little sense for either company. If it were a cash deal, BRY shareholders would be wise to take it; but it is an all-stock deal, and BRY shareholders are receiving massively overvalued LNCO paper for their company. For LINN, it’s buying a capital-intensive, high cost producer at peak earnings – it’s not surprising that BRY could not find another buyer when shopping itself in 2011 and 2012.
A Closer Look at Berry Petroleum
Berry Petroleum (BRY) is an onshore US E&P that has produced oil in southern California for over 100 years. Steam floods in those southern California heavy oil fields remain the Company’s core competency today (46% of BRY’s proved reserves are in CA, and those assets will get 50% of the 2013 capital budget). Over the last 10 years BRY has diversified its oil and gas portfolio, entering the Uinta Basin in 2003, Piceance Basin in 2006, East Texas (Haynesville/Bossier) in 2008, and Permian (Wolfberry) in 2010; those plays make up the current asset base. (The timing of those natural gas acquisitions was unfortunate – BRY paid $19,000/Mcf/d for East Texas in June 2008; recent dry gas acquisition multiples are ~$5,000/Mcf/d.) BRY’s current production is ~40,000 boe/d, ~78% liquids. YE12 proved reserves are 275 MMboe, 74% liquids and 55% developed.
BRY’s production growth has slowed in recent years. The Company’s dry gas production from its Piceance and East Texas plays is in natural decline, as BRY has deferred all drilling activities in those plays; total gas production will decline 10-13% year-over-year in 2013. BRY’s medium-term goal is to offset that decline with 10-15% oil production growth for ~5-10% total production and reserve growth, per annum.
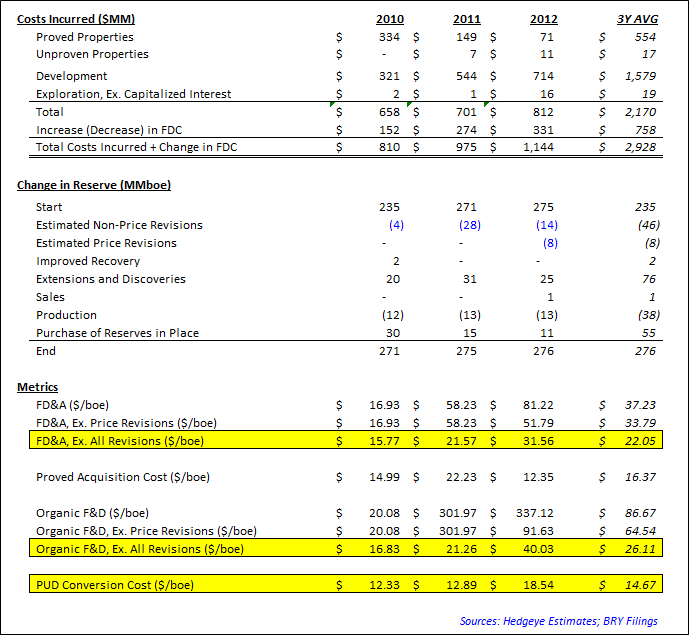
Predictably, both operating and capital costs have jumped as BRY has ramped activity in these high cost, legacy oil plays, putting BRY in the position of a marginal cost producer. In 2010, BRY’s production costs (operating costs + production taxes + G&A + interest expense) totaled $30.24/boe; that same figure was $40.80/boe in 1Q13. On the capital cost side, BRY’s F&D Cost (including our estimated, organic change in future development costs, but excluding all revisions – BRY does not break out price, performance, and timing revisions) was $40.03/boe in 2012, up from $16.83/boe in 2010.

The rapid deterioration in BRY’s capital efficiency is alarming. While BRY does not explicitly break out price-related revisions from performance and timing-related revisions, additional disclosures in the reserve reports suggests that the majority of total revisions over the last three years, -54 MMboe, have been negative timing and performance revisions, not price. Even when excluding all revisions, the FD&A, F&D, and PUD Conversion costs have increased markedly over the last three years (highlighted in yellow):
BRY’s full-cycle costs are now over $70/boe, and the Company is struggling to make a full-cycle profit despite an ideal commodity environment – high oil prices, strong California heavy crude differentials, and low natural gas prices.
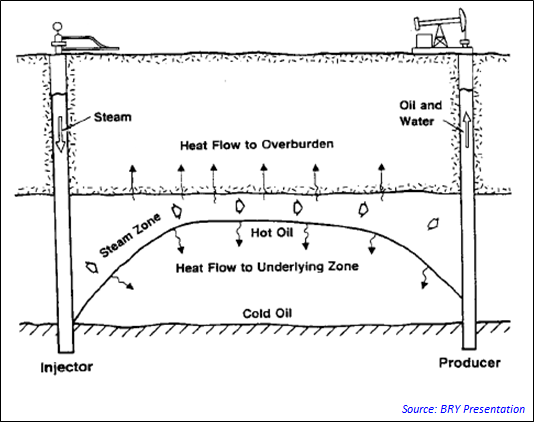
BRY’s heavy oil operations in California rely on natural gas-fired generators to produce steam that is injected into the reservoir to make the viscous oil flow. BRY’s heavy oil fields have steam-to-oil ratios (SORs) between 5.0 and 10.0 (i.e. it takes 5 - 10 barrels of steam to produce 1 barrel of oil; the lower the SOR, the better). For a project with an SOR of 6.0, the steam cost per barrel of oil produced at $5.00/MMBtu natural gas is ~$10.00/bbl. Every $0.50/MMBtu change in the price of gas will have a ~$1.00/bbl impact on BRY’s variable heavy oil operating cost.
In 2010, BRY was a net producer of natural gas, and thus benefitted from rising natural gas prices. But as its gas production has declined and heavy oil production has increased, BRY’s become a net consumer of natural gas. In 2013, BRY estimates that it will produce 47.1 MMBtu/d and consume 73.2 MMBtu/d, putting it net short ~26.1 MMBtu/d (before hedging). Going forward, rising natural prices hurt BRY.
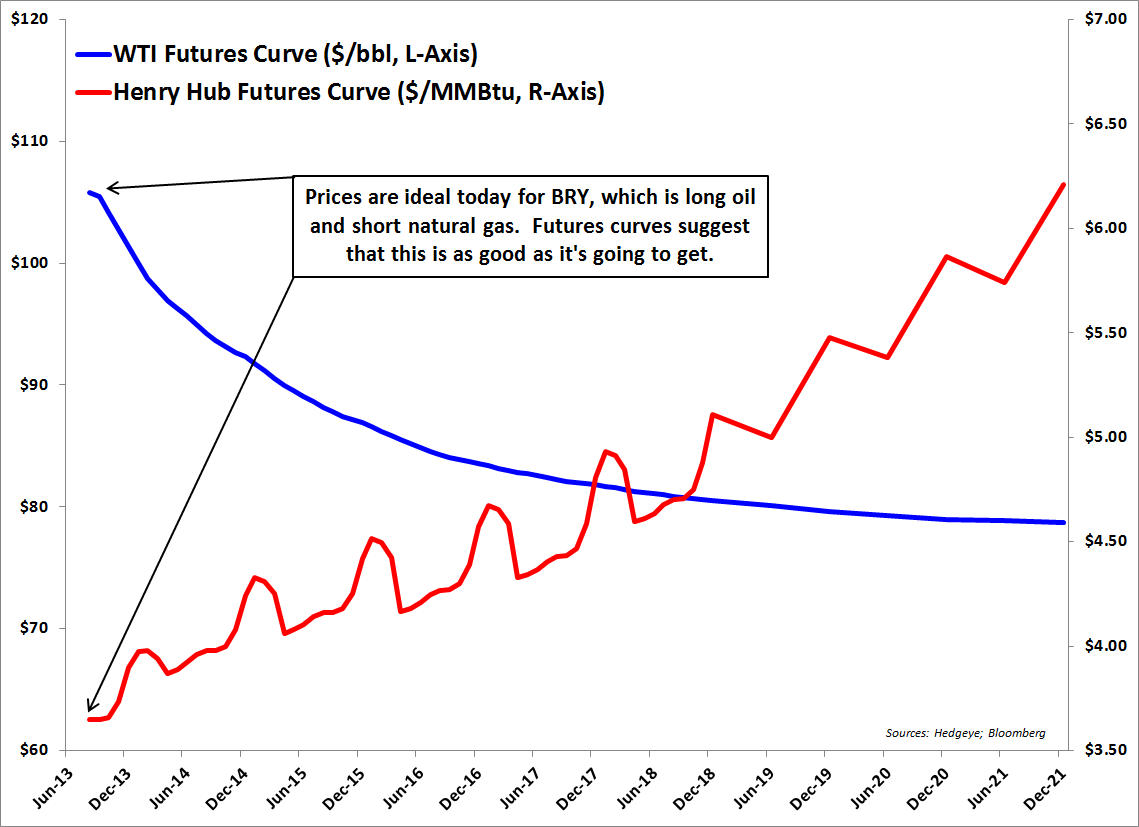
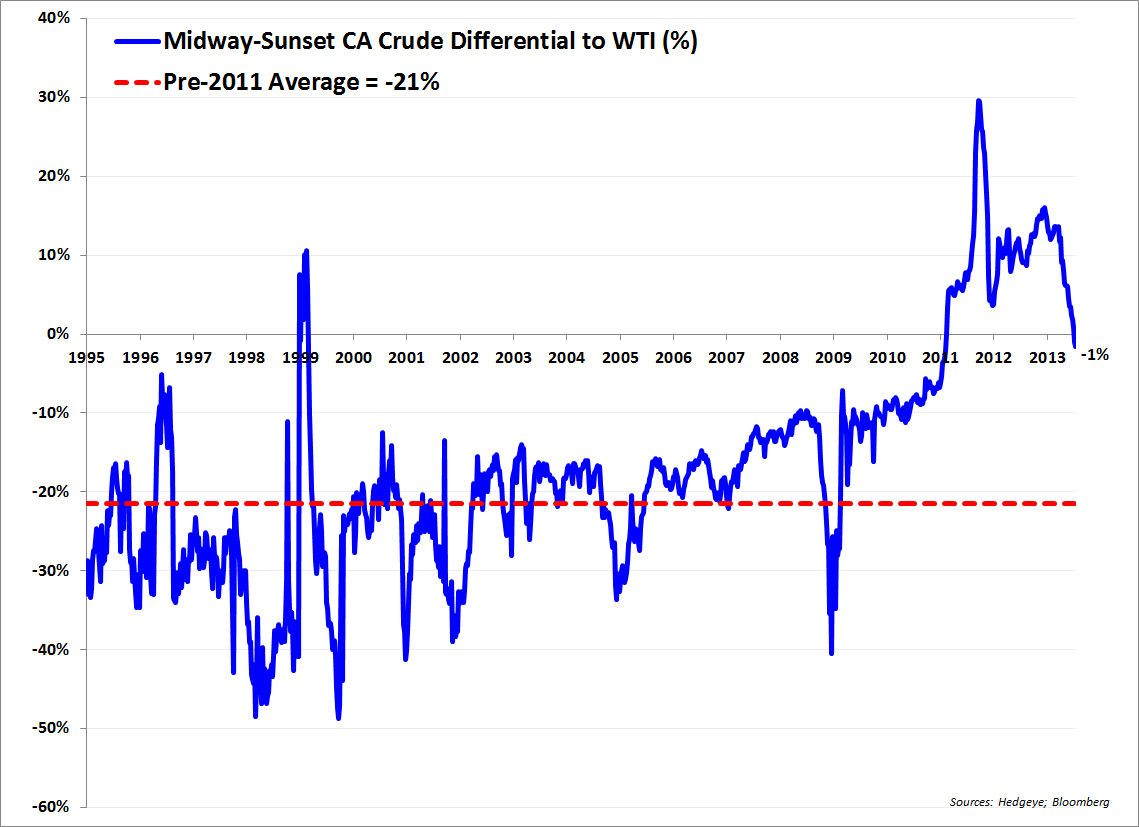
Commodity prices over the last two years have been perfect for BRY, with natural gas in the $3 - $4/MMBtu range and California heavy crudes trading at a steep premium to WTI (vs. the normal 10-20% discount) and above $100/bbl. We think that this goldilocks price environment is unlikely to persist. The WTI curve is sharply backwardated with the 2018 swap trading below $80/bbl, while the Henry Hub curve is in contango with the 2018 swap trading near $5.00/MMBtu. Further, we expect that California heavy crudes will revert back to their normal 10% - 20% discount to WTI as the glut of crude in the mid-continent eases over time. BRY’s California oil production, 63% of total liquids production in 1Q13, is 13 - 15 API degree heavy crude oil – a low quality product – and it has only been trading at a premium to WTI in recent years due to insufficient oil transportation infrastructure, a situation we believe to be transitory. In fact, California differentials have come in sharply in 2013 alongside the WTI-Brent spread. California heavy is now trading at a discount to WTI for the first time in over two years. We see margin compression in BRY’s future.
By our estimates, BRY produced ~4,000 bbl/d of black wax crude oil out of Utah’s Uinta Basin in 1Q13, 13% of total liquids production. There is a niche market for black wax crude in Salt Lake City, and it historically trades at a 15 – 20% discount to WTI. Black wax crude must be trucked or railed in specialized tankers; if the crude does not reach the refinery gate in 4 – 8 hours, it hardens and must be reheated. In 1Q13, BRY’s black wax crude was priced at a $15.65/bbl (17%) discount to WTI.
Since 2007, BRY has sold all of its Utah crude to HollyFrontier’s Woods Cross refinery in Salt Lake City under a contract for 5,000 bbl/d at a set discount to WTI. That contract was set to expire on June 30, 2013, and our read of the 10-K suggests that it was unlikely to get renewed. The 2012 10-K reads,
“Our contract with Holly for the sale of 5,000 Bbl/d continues through June 30, 2013. Before a sales contract in a given area expires, we generally allow potential purchasers to bid for a contract to purchase our oil in the area, and select the contract most beneficial to our business. However, new contracts may not be obtained on a timely basis or on terms beneficial to our business. Based on the current demand for oil and natural gas and the availability of other purchasers, we believe that, with the exception of our primary customer in Utah, the loss of any one of our major purchasers would not have a material adverse effect on our financial condition, results of operations and operating cash flows.”
We are surprised that there was not an update on the status of this contract in the BRY/LINN merger proxy. The market for black wax crude is over-supplied, and Newfield (NFX) is the dominant player in the Uinta and has contracted out the future capacity increases from HollyFrontier and Tesoro. In 1Q13, BRY began shipping some crude via rail to markets outside of Utah. It’s uncertain what the differential will be on those volumes. If BRY’s contract with Holly was not renewed, it may have difficulty marketing this oil production, leading to wider differentials and production curtailments going forward.
NGL production in 1Q13 was ~2,600 bbl/d, 8% of total liquids production.
We estimate that only 16% of BRY’s total liquids production is light, sweet crude oil (Permian Basin); the other 84% is California heavy, Utah black wax, and NGLs. BRY’s historical company-wide liquids differential is ~-12% of WTI. But the premium pricing in California swung the differential to break-even in 2011 and 2012; we do not forecast that to persist, especially with CA heavy driving the production growth going forward, uncertainty with respect to marketing its Utah production, and weak NGL prices.

Berry’s key asset and forward driver of production growth is the Diatomite heavy oil play in southern California. CEO Robert Heinemann said in 2012 that, “It’s going to be the foundational asset of the Company.” The Diatomite will get 32% of the 2013 capital budget. Production from the field is currently ~4,100 bbl/d and BRY’s goal is to ramp production to a peak level of 15,000 bbl/d by 2017. The play is cost intensive – particularly on the operating, labor, and maintenance side. Wells are shallow, drilled to ~800 feet, and generally cost only ~$150k - $400k to complete. The wells come on and produce at 18 – 20 bbls/d flat for about ten years. When they are taken off of steam flood, they quickly decline to 0. Most of the capital is spent on processing facilities, steam-generating equipment, pipelines, and maintenance. With wells coming on around 19 bbls/d, it takes a lot of activity to move the needle, and a lot of maintenance spending to maintain the asset. BRY plans to bring on ~120 new wells per year. Here is what CEO Robert Heinemann had to say about the play on the 1Q12 call:
“Every Diatomite developer usually plans to have about 15% - 20% well failures over the life of the field. And while that is alarming to some people, when you look at the percentage of the expense in the field, if you look capital to expense, expense is about three times the capital in the field. And if you look at replacement drilling in total capital, it's a very small percentage because most of the spend is on facilities, pipelines and equipment.”
What’s strange is that Heinemann is touting the low capital costs of the Diatomite, but as BRY increased its focus and capital on this play in 2011 and 2012, its F&D costs skyrocketed. It doesn’t quite add up.
The Diatomite has been under regulatory scrutiny in recent years. From the 2012 10-K (our emphasis):
“Recent regulatory changes in California have and may continue to materially and adversely impact our production and operating costs related to our Diatomite assets. Recent regulatory changes in California have impacted our Diatomite production. In 2010, Diatomite production decreased significantly due to the inability to drill new wells pending the receipt of permits from DOGGR [California’s Division of Oil, Gas, & Geothermal Resources]. We received a new full-field development approval in late July 2011 from DOGGR, which contained stringent operating requirements. Revisions to the July 11 project approval letter were received in February 2012. Implementation of these new operating requirements negatively impacted the pace of drilling and steam injection and increased our operating costs for our Diatomite assets. The requirements continued to affect our operations through 2012, and we may not be successful in streamlining the review process with DOGGR or in taking additional steps to more efficiently manage our operations to avoid additional delays. In addition, DOGGR may impose additional operational restrictions or requirements. In such case, we may experience additional delays in production and increased operating costs related to our Diatomite assets, which could materially and adversely affect our business, financial condition and results of operations and operating cash flows” (page 20).
It’s concerning that this play – with its 19 bbl/d wells, high costs, and regulatory difficulties is BRY’s “foundational asset.” And there isn’t all that much running room, even if it were a high RoR asset. BRY believes that there is 83 – 144 MMbbls of recoverable oil in the field. 55 MMbbls of proved reserves were booked to the Diatomite in the YE12 reserve report; using the midpoint of the recoverable oil range, 114 MMbbls, that leaves only ~59 MMbbls of non-proved, recoverable oil.
The YE12 PV-10 of BRY’s 125 MMboe of proved undeveloped reserves was $1.3B, or ~$10/boe. Taking into account the impacts of future income taxes, price adjustments for strip pricing and heavy oil differentials, cost inflation, G&A expense, risk associated with non-proved resource, and time value of money, we value BRY’s 59 MMbbls of non-proved resource at $2.00/bbl, or ~$118MM.
This brings us to valuing the BRY enterprise. The YE12 standardized measure is $3.8B; after adjustments for balance sheet items ($1.8B of long-term debt is the big one), we get to a proved NAV of $38.50/share, about where BRY is trading today. However, we believe that this standardized measure significantly overstates the value of BRY’s proved reserves. Our reasoning:
- Recall that BRY is long low-quality crude oil and short natural gas. The YE12 standardized measure holds $96.13/bbl (a $1.42/bbl premium! to the benchmark WTI price) flat over the life of the oil reserves, $39.53/bbl flat over the life of the NGLs, and $2.88/Mcf over the life of the gas reserves. Essentially BRY is getting credit for an ideal commodity price environment in perpetuity, when futures curve are heading in the wrong direction. We feel that these price decks significantly overstate future revenues and understate future steam costs, relative to the current futures curves and normalized crude differentials.
- The standardized measure is not burdened with G&A expenses (true of all standardized measures). BRY’s G&A expenses were $6.24/boe in 1Q13.
- The standardized measure relies on historic operating costs, without escalation, that are too low. Future operating expense per the reserve report is only $18.10/boe, while operating costs in 2012 were $20.43/boe and jumped to $24.13/boe in 1Q13. We expect operating costs to continue to trend higher as gas production declines, heavy oil production grows, and natural gas prices increase.
Our model assumes strip commodity prices, a long-term liquids differential of -8% of WTI starting in 2016, higher and rising operating costs, and G&A consistent with the 1Q13 rate. We calculate the after-tax net present value of BRY’s proved reserves to be $2.4B (~$1.4B below the YE12 standardized measure); after balance sheet adjustments, our proved NAV is $13.00/share.

With BRY is trading at 3X our proved NAV, the question is whether or not there is ~$1.5B of non-proved value in this company to justify a share price near $40.00.
We struggle to see it, and, generally, we are not keen on giving E&Ps value for non-proved resource unless it is clearly warranted. Maybe there’s $100MM - $150MM of value for additional recoverable resource in the Diatomite, as previously discussed. In terms of acreage, BRY has 60k net acres in the Permian, primarily prospective for the vertical Wolfberry. There’s little scale to the acreage, as it’s piecemeal in several counties. Like many Permian producers, BRY has had infrastructure issues hampering production growth, and as a result, it’s taking its rig count down to 3 in 2013 from 6 in 4Q12. We don’t see material undeveloped value for BRY in the Permian beyond what is already captured in the reserve report, which are 42 MMboe of PUD reserves. In the Uinta Basin, BRY has 165k net acres and “approximately 80 MMboe of risked resource” (per BRY presentation) from multiple reservoir targets. $2.00/boe for risked resource yields $160MM of NPV. Looking across BRY’s oil and gas portfolio, we believe that ~$500MM ($9/share) of unproved NAV is generous.
With our proved NAV of $13.00, and $9.00 of additional NAV for non-proved resource, we believe that fair value for BRY is ~$18 - $24/share.
Where’s the Accretion?
LINN states in its 2/21/13 press release that, “The [Berry] transaction is expected to be highly accretive to distributable cash flow per unit. In the first full year following closing, accretion is expected to be in excess of $0.40 per unit.”
With the annual distribution currently sitting at $2.90/unit, the deal is ~14% accretive to DCF in year one. But where is this accretion coming from?
On the 2/21/13 conference call that announced the merger, LINN management stated pretty plainly that there were no meaningful operational or financing synergies, at least in the near-term:
Analyst: “First, congratulations on the acquisition. Just wondering if you see any cost synergies from the deal. And if so, whether that's included in guidance?”
LINN CEO Mark E. Ellis: “Yeah, we really look at this transaction as being focused on creating growth and distributable cash flow is the primary focus here. So I mean that's what's really driving us in the transaction, the adding of the assets together and the focus there. As far as synergies, obviously, there'll be some over time, but that's not our key focus.”
Analyst: “What the appetite is to [refinance] some of [the bonds] Berry has out?”
LINN CFO Kolja Rockov: “Right. No – look, it's a huge opportunity for us in the long-term. In the short-term, we don't feel compelled to do anything quickly.”
In our view, the only meaningful source of accretion for LINE holders is via dropping BRY’s assets – currently taxed at the C-Corp level – into the tax-advantaged MLP structure. According to the deal proxy, this is accretive to the pro forma standardized measure by $1.8B, or $6.00/pro forma LINE unit. This would matter if LINN’s share price was anywhere near its stand-alone net asset value – which we calculate to be ~$8/unit using the standardized measure as our base.
But BRY, like most C-Corp E&Ps, does not currently pay a large amount of cash taxes. In 2012, it paid $5.2MM of current income taxes, $5.0MM of which were state income taxes; in 1Q13, it paid only $1MM of cash taxes (no federal vs. state break out). There is no material near-term tax accretion, with respect to DCF/unit.
So – no near-term operational, financing, or near-term tax synergies…
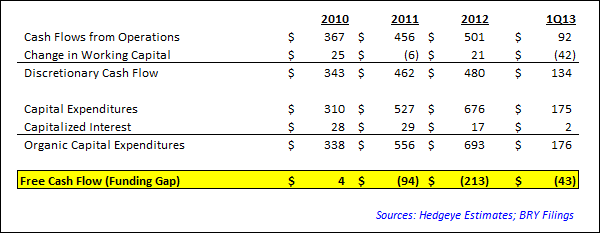
And BRY does not generate free cash flow. In 2012, discretionary cash flow (which we define as CFFO before changes in working capital) was $480MM, while organic capital expenditures (which we define as all cash flows from investing activities excluding A&D) were $693MM, for negative free cash flow (“funding gap”) of -$213MM. In 1Q13, the funding gap was -$43MM, or -$172MM annualized. We estimate that BRY will generate ~$550MM of discretionary cash flow in 2013; the 2013 capex budget as of BRY’s February guidance is $500MM - $600MM, though LINN’s implied 2H13 production guidance for BRY implies that the Company will spend more than that; and the 1Q13 capex spend annualized is $706MM. BRY’s capex budget is typically front-end loaded, though it is in on pace to mimic the 2012 capex budget. BRY’s reiterated its 2012 capex guidance of $600 – 650MM back in April 2012 after 1Q12 capex came in at $173MM. Actual 2012 capex came in ahead of budget at $693MM, and BRY spent more in 1Q13 than it did in 1Q12. We believe that $650MM is a fair estimate for FY13 capex, which puts BRY at a FCF deficit of ~$100MM for the year.
LINE is issuing 70MM new shares, increasing the total unit count by 30%, to tack on ~$100MM of annual negative free cash flow. On a FCF/unit basis, the deal is massively dilutive. How does LINN make it DCF/unit accretive?
In our view, the main source of the DCF/unit accretion that LINN cites is via understated maintenance capex on the BRY assets.
LINN’s management stated on the 2/21/13 conference call that,
“Maintenance [capex on the BRY assets] is around – I think we've got in there for a stub year about $120 million. The full year is about $240 million. And we utilize the same concepts were created for accessing maintenance on their assets like we do on our own, from a standpoint of replenishment of the reserve base and based on the quality of their asset – their investment opportunities” (LINN CEO Mark E. Ellis).
In our view, LINN’s claim that BRY can keep production and reserves flat on $240MM of annual capex is unjustifiable. BRY’s production growth is slowing to low-single digits on an annual basis. In 1Q13, production was 39,676 boe/d, up 0.4% QoQ; LINN’s 2013 guidance implies that production from the BRY assets in 2H13 will average 40,368 boe/d, up only 1.7% over the 1Q13 rate. And BRY is spending over $600MM in total capex to deliver that growth.
As we have already discussed, BRY’s capital efficiency has deteriorated significantly over the last three years. LINN’s pro forma guidance implies that in 2H13, stand-alone BRY maintenance capex will be $16.29/boe; compare that to the 2H13 DD&A guidance of $25.65/boe, BRY’s 3Y average F&D cost of $26.11, and BRY’s 2012 F&D cost of $40.03/boe.
BRY stand-alone can barely grow total production on +$600MM of annual capex. But after LINN acquires BRY, it can keep production flat on $240MM of annual capex, with no material synergies. We don't see how that's possible.
The main source of DCF/unit accretion is financial engineering; it is why we believe that this deal – which is highly dilutive on a FCF/unit basis – actually makes LINN’s fundamental problems worse in the long-run.
Stock Thoughts
We do not have a strong view on what ends up happening with the LINN/BRY merger. We don't think that it closes on the current terms – all-stock, 1.25x exchange ratio – but if LINN sweetens the terms, it could very well happen. Much depends on the outcome of the SEC’s informal inquiry and the prices of LINE/LNCO, which we have no edge on.
If the LINN/BRY merger closes, there will undoubtedly be a short-term relief rally in LINE/LNCO, and it will be painful to experience knowing that nothing has changed.
If the LINN/BRY merger falls apart, we expect LINE/LNCO shares to fall, and we would strongly consider shorting BRY on that news.
Kevin Kaiser
Senior Analyst
