The May Payroll data improved sequentially, confirming the ongoing strength observed in the NSA Jobless Claims numbers over the last month. Private and Nonfarm Payrolls both improved sequentially, the Unemployment Rate increased to 7.6% with mixed job growth across age demographics, Temp employment growth accelerated for a third consecutive month and State & Local government employment growth went positive for the first time since June 2009. After seeing a collective +114K revision for Feb/March in the April release, today's NFP estimates reflected a net two month revision of -12K with March revised from +138K to +142K while April was revised from +165K to +149K.
Conclusion: On balance, today’s employment report leaves our fundamental view in the same place it has been for the YTD. The Macro data (Labor/Housing/Confidence/Credit) in the U.S. continues to look good on an absolute basis and better than good on a relative basis vs. the EU, China, Japan, Russia, and the bulk of emerging markets.
The domestic growth dynamics along with an improving federal fiscal position and incrementally hawkish monetary policy outlook still has us liking #StrongDollar, favoring domestic consumption and growth positive equity exposure, and disliking negative dollar/growth leverage (Gold, Commodities, Russia, select EM markets).
6% Unemployment: Given the Fed’s explicit targeting of 6.5% unemployment and the likelihood for market expectations to continue to attempt to front run the slope in the unemployment rate – how do the numbers have to move for the unemployment rate to move below 7% in 2013?
If we make the simplifying assumptions of stable population growth and a static Labor Force Participation Rate from here we need to average net payroll adds of ~253K/mo over the next 7 months to breach 7% on the downside in December.
If we use Nonfarm Payrolls as our proxy for monthly employment gains, year-over-year growth would need to average ~1.85% over the balance of the year. With NFP employment growth averaging 1.57% and 1.61% over the last 6M and 12M, respectively, this equates to ~27bps acceleration from current levels.
Below is a summary review of the April employment trends observed across both the Current Population Survey (Household Survey), which drives the Unemployment Rate, and the Establishment Survey (CES) which drives the NFP Number.
Non-Farm Payrolls (Establishment Survey): NonFarm Payrolls rose 175K in May on expectations of 163K and 165K prior with y/y growth accelerating a marginal 3bps sequentially to +1.58%. Private payrolls rose 178K on expectations of 175K and 176K prior with y/y growth accelerating 5bps sequentially to +1.9%. The revision to the March and April estimates saw March revised +3K from +138K to +142K while April was revised lower by 16K from +165K to +149K.
Household Employment: BLS’s Household survey of employment showed total employment increased 319K m/m with y/y employment growth flat sequentially.
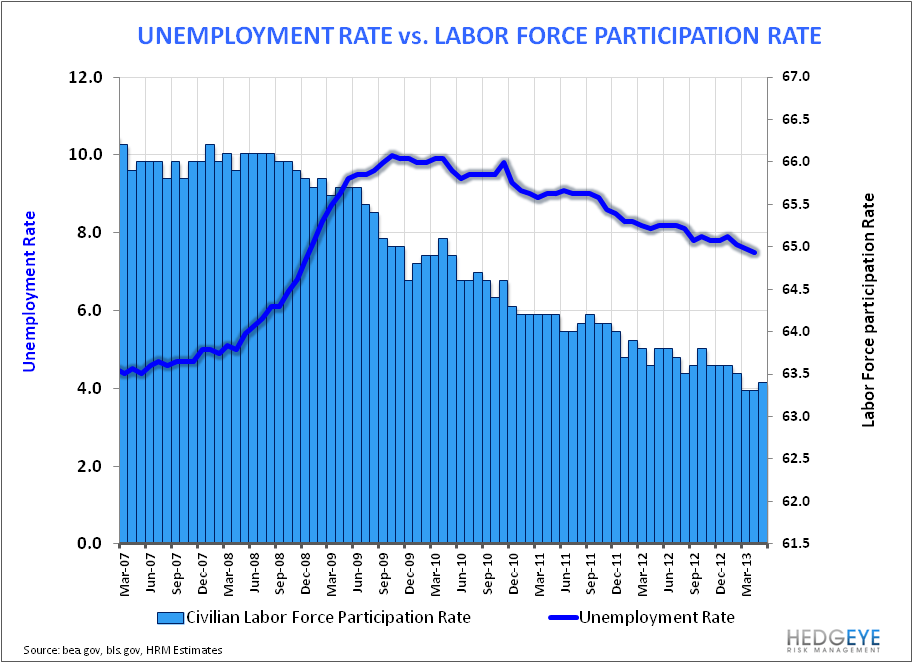
Unemployment Rate: The Unemployment rate increased to 7.6% in May from 7.5% with Total Employmed rising +319K and Total Unemployed rising +101K. Recall that the Unemployment Rate simply = Unemployed/(Employed + Unemployed) – thus, if the rise in the numerator is higher on a percentage basis than the rise in the denominator, as occurred in May, the unemployment rate will rise. Note also, if you carry the unemployment rate out an extra decimal point, the unemployment rate increased 5bps sequentially from 7.51% in April to 7.56% in May.
Labor Force Participation: The Labor Force Participation rate (LFPR) ticked up 12 bps to 63.44% in April vs 63.32% in March, essentially flat with recent trough levels. As a reminder, the LFPR = Total Labor Force (Employed + Unemployed)/Civilian Non-institutional Population. The Civilian non-institutional population was up +188K m/m while the total Labor Force rose by +420K. Here, the greater relative increase in the numerator = a marginal increase in the Labor Force Participation Rate.
Employment By Age: Employment by age demographics were mixed in May with 25-44 YOA and 65+YOA accelerating while all other age buckets slowed sequentially. Employment growth remains positive across all age cohorts on both a monthly and quarterly basis with the exception of 45-54 year olds where, after managing to go positive briefly in 2012, payroll growth has remained mired in negative territory.
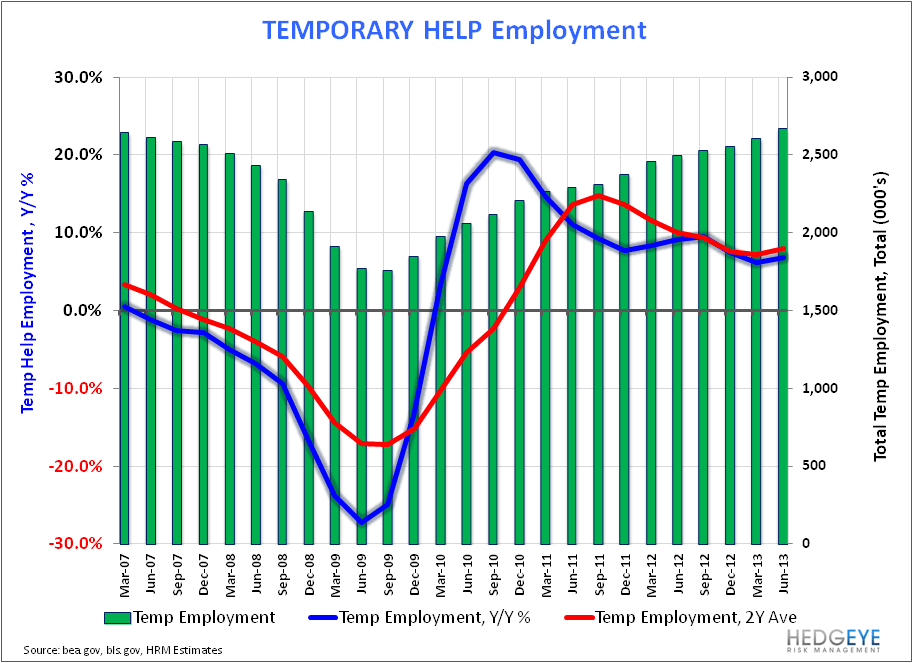
Part-Time & Temp Employment: Part-time employment (household survey) increased 150K m/m while Temp employment (establishment survey) rose 26K in May. While the growth trend in part-time employment remains one of deceleration, growth in Temp Employment accelerated on both a 1Y and 2Y basis for the 3rd consecutive month.
Obamacare remains a factor we continue to monitor as it relates is the potential for accelerating part-time and Temp employment. Corporate attempts to manage worker hours under the 30-hr threshold dictated under Obamacare would serve as a tailwind for employment growth but likely act as a drag across hours worked and weekly earnings metrics. The re-acceleration in Temp hiring appears supportive of the thesis while the trend in hours worked and real weekly earnings (which has been positive the last 3 months) are largely equivocal at present.
State & Local Gov’t Employment: After five years of negative growth, collective State & Local Gov’t employment growth managed to go positive in May, growing 0.08% y/y. With labor trends positive and state tax revenues making higher nominal highs we expect employment & investment trends at the state and local level to remain positive, on balance.
Average Weekly Hours: After declining 0.6% m/m in April, average weekly hours for private employees held at 34.5 hrs in May, flat m/m and +0.3% y/y.
BLS Household Survey Data


BLS Establishment Survey Data


Christian B. Drake
Senior Analyst
