Below is the breakdown of this morning's claims data from the Hedgeye Financials team. If you would like to setup a call with Josh or Jonathan or trial their research, please contact .
Labor Market: Divergences Finally Becoming Apparent
The funny thing about economic data series is that the inflection breaks often aren't apparent until well after the fact, i.e. 20-20 hindsight. That's why its important to spot things early and try and understand a) why they're happening and b) the implications.
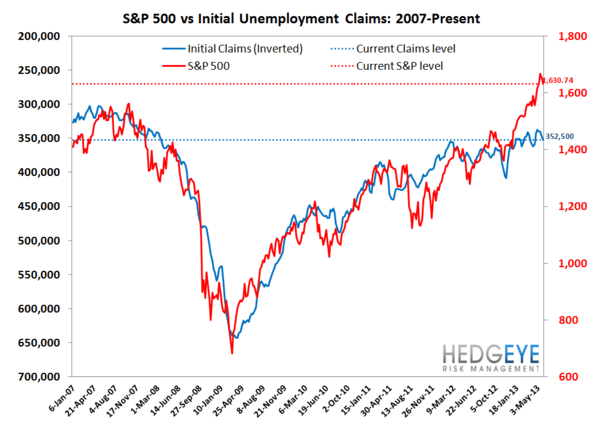
With that in mind, the divergence between the SA and NSA initial claims data is finally beginning to become apparent. As the first chart below shows, the seasonally-adjusted data is now almost flat in the March to present time period (the purple hatched line is almost level). This is an inflection from the August 2012-February 2013 environment of notable negative slope (steadily improving claims). The inflection is expected as it is following the same trend over the past three years, owing to faulty seasonal adjustment factors in the government's model. It's important because the market still cues off the SA data, so, to the market's eye, the data is beginning to stagnate.
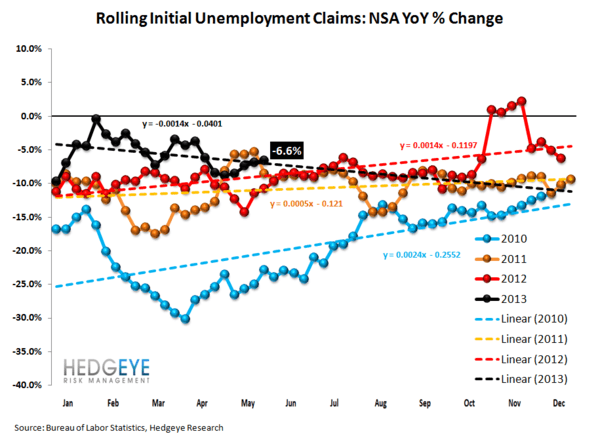
In the second chart we show the NSA data, which continues to improve at a well-above trend rate. Note the negative slope in the black line vs. the positive slopes in the previous years' lines. In this case, negative is good, because it depicts accelerating improvement.
To the extent the recent sell-off continues, likely on the back of the Fed-in-a-box narrative (good news = bad, bad news = bad), we think this labor market data makes it clear that investors should be buying red, but doing so with the understanding that the labor data will continue to appear to deteriorate through August (3 more months) before again beginning to turn positive.

The Data
Prior to revision, initial jobless claims fell 8k to 346k from 354k WoW, as the prior week's number was revised up by 3k to 357k.
The headline (unrevised) number shows claims were lower by 11k WoW. Meanwhile, the 4-week rolling average of seasonally-adjusted claims rose 4.5k WoW to 352.5k.
The 4-week rolling average of NSA claims, which we consider a more accurate representation of the underlying labor market trend, was -6.6% lower YoY, which is a sequential deterioration versus the previous week's YoY change of -6.9%


Joshua Steiner, CFA
Jonathan Casteleyn, CFA, CMT
