Investing Ideas Updates:
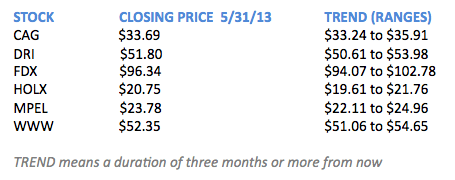
- CAG: Despite CAG being weak along with the broader staples group in recent days (see our Investing Ideas write up on the group last week), Consumer Staples sector head Rob Campagnino continues to see significant value in CAG. Commodity prices continue to trend lower with a longer-term positive impact on margins. Further, we continue to see the prospects of double digit earnings-per share (EPS) growth (elusive in staples) due to the combination of merger synergies, organic growth, margin expansion and deleveraging. (Please click here to see the latest Stock Report on CAG.)
- DRI: Restaurants sector head Howard Penney has no update on Darden (DRI) this week. (Please click here to see the latest Stock Report on DRI.)
- FDX: Industrials sector head Jay Van Sciver has no update this week on FedEx (FDX). (Please click here to see the latest Stock Report on FDX.)
- HOLX: This week, Hologic received FDA approval for its new “C-View 2D” imaging software, permitting mammography to be done with lower radiation exposure levels, and with less time under compression, making the process more comfortable for patients. The new imaging boxes can be fitted to existing machines, giving practitioners flexibility. The technology is already in use in the EU and other countries. Healthcare sector head Tom Tobin says this is not a major development, but it shows that HOLX’s business plan remains on track. We give details from Tobin’s second quarter Healthcare themes call below in this week’s Sector Spotlight. He says HOLX is well positioned to benefit from coming increases in physician utilization, and from the Affordable Care Act. (Please click here to see the latest Stock Report on HOLX.)
- MPEL: Gaming, Leisure & Lodging sector head Todd Jordan says this past week’s Macau gaming figures came in a bit softer than anticipated. Average daily table revenues declined 11% from April levels, but were still 10% above the comparable week last year, indicating a seasonal component to this turn. Jordan anticipated similar growth in June, over June 2012, which should then accelerate into July. On the top line, Jordan’s work suggests monthly gross gaming revenue growth (GGR) is accelerating. He says GGR growth should come in at 13% for May, trending slightly higher in June, and could hit 20% in July. Says Jordan, “These numbers are likely to keep the momentum going in the Macau stocks – Melco Crown Entertainment (MPEL) remains our top pick.” (Please click here to see the latest Stock Report on MPEL.)
- WWW: Retail sector head Brian McGough says the Street is grossly underestimating the revenue growth opportunity as WWW scales its recently-acquired brands over its global infrastructure. Under their former owners, Sperry, Keds, Saucony and Stride-Rite only generated 5% of sales outside of the US – and most of that was in Mexico and Canada. Meanwhile, the legacy Wolverine World Wide is truly “worldwide” with 65% of units sold outside the US through a network of integrated third-party distributors. With this infrastructure in place, McGough says incremental global sales should come in at close to 20% margin, compared to the 8% margin they currently generate. WWW needs only minimal capital to grow these brands globally, which means most of that additional margin turn into earnings. McGough thinks WWW can be a double over the next two to three years. The stock might look expensive, he says, but he thinks the Street’s projections are too low. “We’d buy aggressively on a pullback,” says McGough, “but we’re not so sure that will happen.” (Please click here to see the latest Stock Report on WWW.)
Macro Theme of the Week: All Along the Watchtower
The word “Speculate” comes from a Latin word meaning “watchtower.” A “speculator” is someone who peers off into the distance, watching events on the horizon so as to be prepared when they arrive.
We have been scanning the horizon on the Macro scene for over five years now, and we are not overstating our case when we say we have been more right than wrong, both on our Macro calls and on our stock trading signals, (available at our website as “Real-Time Alerts.”) Lately we have repeated our Strong Growth message so often we are running out of new ways to say it.
In January our first quarter Macro Themes call featured Growth Stabilizing, and Housing’s Hammer. We followed that in April when our second quarter Macro themes call featured Growth Accelerating and Strong Dollar. In the second quarter we wrote “After a positive growth inflection in US macro data to start the year, the key risk-management consideration from here is whether domestic growth can accelerate in the face of seasonal and fiscal policy headwinds. Alongside strong dollar benefits to discretionary demand, labor market, housing and birth trends should remain supportive of consumption over the intermediate term.”
Now we are heading into that Intermediate Term, and consumption is blowing through a lot of Wall Street analysts’ projections. First, economic growth showed distinct signs of stabilization – as we noted in our first quarter call – then growth took off, as we noted in the second quarter.
OK, we admit it. We were right.
And the Dollar continues to strengthen. Like the surging US housing market – who’d ‘a thunk it? – Dollar price strength is blowing the top off global currencies. Again, quoting from our second quarter call, “We see a strong US Dollar deflating Bernanke’s commodity bubbles, which should boost US consumption.”
Plenty of analysts and investors are waiting for the rally in the stock market to spill over and touch off a rally in the depressed commodities markets. Hedgeye CEO Keith McCullough cautions that “buy” signal will likely also point to a downturn in the equities markets. Contrary to what lots of folks anticipate, US consumption growth is historically tied to lower commodity prices, not higher ones.
Put simplistically, Strong Dollar knocks down Commodity Prices. Which means lower gas prices at the pump, and lower corn and poultry prices. Which means more consumers getting in their cars to drive to the mall. Where they buy corn flakes, sugared sodas, and monster fried chicken buckets.
If you think like a trained economist – four years of college, five more years to get your PhD, followed by three years as a post-doc, then three to five more years before you find out you are not being considered for the one tenure-track position available in your department – you could see ripple effects from one market to another. After all, assets are assets, right? And you might start building complex models to predict when the rise in the stock market will ignite a parallel rise in commodities.
But if you think like an uneducated person you figure, as gasoline prices go higher you will drive less. When you drive less, you don’t go to the mall. When you don’t go to the mall, you don’t shop at the Gap, H&M, The Apple Store, or Old Navy, and you don’t eat at any of the fancy casual dining family restaurants.
What you do instead is, you sit home and watch TV.
And you probably still eat at McDonald’s.
Hedgeye Restaurants sector head Howard Penney just pulled out a whopper (oops…) of a statistic about Mickey-D’s, which is that over 70% of their customers basically only order off their Dollar Menu. This looks like a permanent cap on MCD’s ability to grow their business domestically. Why would you buy a double-quarter-pounder-with-cheese meal for $6 when you can buy fourMcDouble cheeseburgers plus fries and a soda off the Dollar Menu at the same price?
Meanwhile, that house your local Couch Potato is sitting in watching TV? – It just went up in value.
Housing Keeps Hammering: This week the Case-Shiller home prices index rose 10.9% for March, above analyst expectations. It was the fastest pace of increase since April 2006 – since before the housing bubble that blew the global economy to smithereens.
The S&P/Case-Shiller index is named for economists Karl Case and Robert Shiller, who developed the long-term series based on repeat sales of single-family homes. The focus on repeat sales of the same homes is designed to develop patterns of home pricing based on like-to-like comparisons. Yale professor Shiller believes no other country has published such a comprehensive record of home prices.
Shiller says US home prices have a clear tendency to consistently return to a baseline, which is the price in real terms of that same home, or an equivalent, in the year 1890. You read that correctly. That is 1890, nearly a century and a quarter ago. Shiller, a behavioral economist, says people generally overestimate how much their house would fetch on the market; people buy and sell houses infrequently, so they remember the price they paid and are often surprised at the difference between their expectation and the actual current bid or final purchase price.
While house prices have a strong tendency to mean revert, there can be sustained price bubbles that can have a real impact on the economy. Shiller points to periods when prices remained well above the 1890 real price level. One such period was from 1, helped along by the GI bill, and by a broad desire for stability in the aftermath of the Depression and WWII. The global real estate boom that took off in 1997 ran for around two decades. And though it ended in a global disaster, plenty of folks made real money along the way.
House prices are a powerful indicator of what economists call people’s Propensity to Consume: if you are confident that your single most important asset is increasing in value, you are comfortable peeling a few of your hard-earned bucks off your wad for a night on the town. Or an afternoon at the mall. That is called the Wealth Effect: as basic assets rise in price (your house, your stock portfolio) people become increasingly comfortable spending money. And note that this powerful psychological effect keys offPrice, which is the only proxy we have for the more rarified concept of Value. Since the Wealth Effect takes time to settle in, we are pretty confident that we have not yet seen anything like the full effect on Consumption that improving house prices and a strengthening labor picture will produce.
Financials sector head Josh Steiner says reported jobs and unemployment figures mask an underlying positive trend. Steiner says Bureau of Labor Statistics unemployment numbers are based on a “faulty seasonality adjustment dynamic we often highlight.” Translation: As we’ve said over and over, the BLS numbers are plain wrong. “To be clear,” writes Steiner, “not only is the labor market improving, but it is doing so at an accelerating rate.”
Keep your eyes on the horizon. That cloud of dust could be the next leg up of the market. As Keith has been saying lately, lots of folks are bullish now. But are they bullish enough?
Sector Spotlight: Health Care
Health Care sector head Tom Tobin had a lot to say this week, as economic and demographic factors driving his sector coalesce to lay the groundwork for what could be an extended positive cycle.
In his presentation of major themes for the second quarter, Tobin highlighted “Physician Utilization,” “Baby Bust,” “Easy Compares,” and cumulative effects on the sector from the Affordable Care Act (ACA).
Physician Utilization: Who goes to the doctor? Lots of folks in the 35-54 year old age group, who are just now experiencing an improving employment picture. Economic factors drive doctor visits with about at one to three quarter lag, meaning that an improved labor picture in June should result in more doctor visits starting in September, and possibly rolling out to next June. Meanwhile medical practices are hiring steadily, anticipating a steady flow of patients.
Employment is a significant driver of doctor visits, with the combination of employer-provided health plans, plus the regular paycheck. Disposable income pays for deductibles, and makes discretionary health spending possible – having that spot on your shoulder checked, or going to the doctor the first day you feel a bit unwell rather than waiting until your have been down with a fever for three days. Tobin sees employment rising in significant health care user age groups and says the economic rebound should lead to a recovery in health care spending which, though it will probably not be a straight line up, could be significant and long lasting.
Baby Bust: Births declined by 9% during 2007-2012, capping a 40-year decline in the US birth rate. Tobin says this sharp drop represents a pool of “deferred births” which should jump-start a birth rate recovery. With an improving economy, first-time mothers who waited through the years of the financial crisis will feel confident starting a family, while women who put off having a second or third baby due to a dismal economic outlook should feel better about expanding their family. Tobin notes a strong correlation between the birth rate and rates of women’s employment. The decision to have a baby is tied to economic expectations. But actually having the baby, that’s an economic reality!
Tobin believes the turn could add as much as 3% to 4% to current birth rates, or an additional 1.4 million births over the next three to five years. Maternity is a major factor in outpatient utilization, as women are seen regularly during the course of their pregnancy. And anyone who has ever raised a child knows how many hours are spent in a pediatrician’s office. On the hospital side, maternity drives 25% of overall inpatient admissions.
Easy Compares: Mild weather and a calendar shift that included Leap Day led to inflated results being reported in the first quarter of 2012, and to a comparatively slower in the second quarter of 2012. Anyone who has been invested in health care stocks this year knows how badly the year started, but Tobin says the second quarter is likely to surprise to the upside. (Of course, such developments will only be “surprising” if you aren’t staying alert up there on the watchtower.)
A heavy winter in the first quarter of 2013 kept folks indoors. Instead of going to the doctor with a sniffle, people stayed home and drank tea. In contrast, last year’s mild winter “pulled forward” doctor visits into the first quarter, leading to a comparative drop in doctor visits in the second quarter of 2012. First quarter comparisons – which is how analysts decide whether a company is moving in the right direction – were dismal, while the second quarter came up looking relatively worse.
This year, says Tobin, the second quarter numbers will look relatively better. What does this mean for stock prices? The sector is coming off a period where it saw management cutting guidance the most – and raising it the least – of any time in the last five years. Meaning anything merely Better Than Awful could be taken as really positive.
Obama-Care: Finally, Tobin says there are pockets of real economic impact under the ACA, though the total economic tailwind to the entire medical economy will end up being quite small – probably less than 2% a year.
Hospitals and providers will get paid, while insurers will face a poor risk / reward tradeoff for offering coverage. The newly-employed – and thus newly insured – will be largely a younger demographic, so we expect only a small number of products and services to show meaningful increase initially. But if growth is able to sustain, this demographic can be expected to work its way through the entire range of health care products and services.
Unsurprisingly, the biggest increase in health care utilization is projected to be maternity related (though we note that analysis of utilization rates places “psychosis” in third place, behind natural and caesarian births.) But spending under the ACA should also improve revenues at family practices, and contribute to steady increases in diagnostic testing and in prescriptions.
The turn in the economy – improving house prices, improving employment – and the turn in the birth rate are the result of major shifts that have taken a long time to manifest, and are thus deeply entrenched in the economy. This is not to say nothing can go wrong. But it is to say that many things have to go wrong successively – or some major thing has to go spectacularly wrong – to wreck this bullish scenario for health care.
Of course, if you are any kind of observer of America’s political and economic scene you know that sooner or later, either lots of things will spiral out of control – or some really major thing will go spectacularly wrong.
Until then, Tobin offers the single best piece of advice for anyone concerned about their health – or their stock portfolio.
Always get a good night’s sleep.
Investing Term of the Week: Dow Jones Industrial Average
The Dow Jones Industrial Average was created on May 26, 1896. Happy birthday, DJIA!
The purpose of market indexes is to have some manageable metric to track the market’s performance. As Nobel Prizewinning economist Joseph Stiglitz points out, the results you end up with depend on what you are measuring. (And don’t forget the important corollary: If you measure the wrong things, you will certainly get the wrong results.)
Indexes are part of our effort to glean readable information from the All-Knowing Market about what the broad US economy is up to. At any given moment during the trading day, the level of the DJIA is a reflection of what the world expects our stock market to do. And since stock prices comprise the sum of all our expectations, an understanding of how stock prices behave should yield an understanding of how we our economy will act in the future.
The DJIA was created by then-Wall Street Journal editor Charles Dow – co-founder of Dow Jones & Co. The idea was to identify a handful of companies that represented the broad scope of American industry. The original index contained 12 stocks, including such now-forgotten names as American Cotton Oil Company, US Leather, Distilling & Cattle Feeding Company, and US Lead. The index now comprises 30 companies. Of the companies originally on the list, the only survivor is General Electric. It may require a stretching of the imagination to see how many of the other 29 qualify as “industrial” companies.
Alcoa is on the list. But so is American Express. Caterpillar and Du Pont are on the list, but so are JPMorgan Chase and McDonald’s. Thus does the DJIA attempt to reflect what is most representative about the American marketplace.
Armed with powerful algorithms and high-speed computers – but also with pencils and straightedges – armies of technical analysts watch changes in the averages to determine future moves in the market. The DJIA is not to be confused with the analytical system called Dow Theory – named after Charles Dow and based on his observations on the markets, though not created by him. But the key tenets of Dow Theory are also to be found in other approaches to technical analysis.
They include such notions as Primary and Secondary market trends, accumulation and distribution phases within trends, the idea that price movements must be confirmed by trading volume, and the proposition that the stock market immediately discounts all news (also a key building block of Efficient Market Theory).
The DJIA is based on an average of the prices of the thirty stocks, divided by a “divisor,” which is adjusted periodically to keep index values consistent. One criticism of the DJIA is that it is hardly representative, containing only 30 stocks. Compare this to the S&P 500 index, or to the Russell 2000 small cap index. Or to the Russell 3000 index.
Perhaps more significant, the DJIA is a price-driven index. It represents an average of the prices of thirty stocks at any given moment. Compare this to the S&P 500, which assigns weights to the stocks, commensurate with their capitalization in the marketplace. You might say that the DJIA indicates what price people are willing to pay to own American industry, while the S&P indicates how much or how little of they want to own at any given moment.
Hedgeye’s newest rising star, Financial sector analyst Jonathan Casteleyn, points out that the Dow Jones Transportation Index (the “Transports”) is a more useful index to track industrial activity. The somewhat amorphous behavior of the prices of thirty industrial (or not so clearly “industrial”) stocks is less revealing than an index that tracks how much stuff is getting shipped. Transports prices, like any other stock prices, are a function of people’s expectations. When people expect the sector to make a lot of money, the stocks rise. So an upturn in the Transports signals increased optimism in American industry as more manufactured stuff, and more people, gets shipped around the country. This is a concept even we understand.
Casteleyn says Warren Buffett’s railroad investments make perfect sense as a Transports play. With broad stretched of the Mississippi running dry, we need alternative means of moving goods around the country. Casteleyn calls Buffett an “anthropological investor.” From his perch atop the watchtower in Omaha, Buffett scans the horizon to identify what our society will need (transportation), desire (Coca Cola) or be afraid of (insurance) in order to keep the American way of life running.
Speaking of anniversaries, sixty years ago this week (May 29, 1953) Edmund Hillary and Tenzing Norgay reached the summit of Mt. Everest. With the major stock market indexes hitting all-time highs, we too are reaching summits that have never before been scaled. Indeed, some folks find the air mighty thin up here. Here at Hedgeye we are holding onto the rope and putting one foot in front of the other.
Welcome aboard, Jonathan.
Onward and upward!
