This note was originally published at 8am on May 17, 2013 for Hedgeye subscribers.
Jack & Jill: “Jack fell down and broke his crown & Jill came tumbling after”
Rock a bye baby: “When the bough breaks, The cradle will fall, And down will fall baby, Cradle and all.”
Rub-A-Dub-Dub: “Rub-a-dub-dub, three men in a tub”
Have you ever actually listened to the lyrics of the traditional nursery rhymes?
I honestly don’t even remember how the last one ends, but I imagine 3 men in a bath together could go downhill quickly. Some pretty morbid content for young minds at their peak of neuroplasticity.
Back to the Global Macro Grind…..
It’s been serene slumbering for the better part of the last 6 months as our macro model front-ran the inflection in domestic #growthstabilizing in late November. TREND Macro moves are generally self-reinforcing and catching the positive or negative inflection in the slope of growth represents the REM period of actively managed alpha.
But, alas, Rip Van Winkle and real-time, globally interconnected risk rarely make sustainable bedfellows. After riding the expedited 300-handle advance in the SPX, we went net short yesterday for the first time since November 2012.
Does that mean we’re abandoning the #StrongDollar-Strong Domestic Consumption mantra we’ve been captaining for the last 5 months?
Nope.
Here is where it’s important to understand how the Risk Management & Fundamental Research sides of the Hedgeye model co-integrate to drive invested positioning.
As Keith highlighted yesterday, “I am getting my first coordinated overbought (SP500) and oversold (Gold) signal of 2013. Both signals are explicitly linked to an overbought one in the US Dollar Index”
What does that mean in the context of our constructive fundamental views on the Dollar, Domestic Consumption, and Housing? In short, it means that so long as our research view on that trinity of factors remains positive, we’ll cover shorts, buy back the same exposures we sold yesterday and get net long again when the signal indicates we’re no longer overbought or if/when we move towards the oversold 1636 line on weakness.
Since our bull case was largely predicated on Strong-Dollar, Housing, Employment & Consumption, let’s summarily review the latest across those metrics.
$USD: Mother Nature likes redundant systems and so do we. With federal deficit spending declining dramatically, domestic monetary policy turning incrementally hawkish, and explicitly dovish commentary out of Japan & the EU unlikely to ebb, we think the dollar can continue to appreciate via numerous routes. Ongoing dollar strength, perpetuated by a continuation of the above dynamics, would augur more of the same for commodity and gold price deflation.
Employment: We consider the 4-week rolling average in y/y, Non-seasonally Adjusted Claims to be the most accurate reflection of underlying labor market trends. On that metric, yesterday’s update showed a 20bps deceleration WoW with rolling NSA claims going to -8.9% YoY vs. -9.1% YoY the week prior. Despite that sequential deceleration, -8.9% YoY improvement represents a very good rate of decline. Moreover, organic 2Q trends to date have overwhelmed any negative seasonal distortion or sequestration associated drag. On balance, we’d still view labor market trends as positive.
Housing: We continue to maintain a positive view on housing broadly, but in light of yesterday’s weak headline print in housing starts, let’s narrow the focus to our expectations for starts specifically. In short we would view a multi-year doubling of housing starts to 2M annualized units as a high probability scenario.
Consider this basic imbalance. Since the start of 2011, new household formation has been running at an annual rate of 1.38 million. Historically, due to factors such as Vacant Unit demand and Demolitions, the ratio of new housing demand to new household formation has run at approximately 135%-139% (see here & here for the supporting research). At the current rate of household formation, this equates to demand for 1.89M housing units. Instead we've begun construction on 0.845 million, or just 46% of the level needed.
Note also, against demand implied by household formation, we’ve incurred a cumulative deficit of 3M new housing units since the start of 2010. Some percentage of this deferred demand should materialize as the economy improves, exaggerating organic demand trends over the next few years.
One month does not a trend make. Clearly, there remains a significant delta between new housing units needed and units being created.
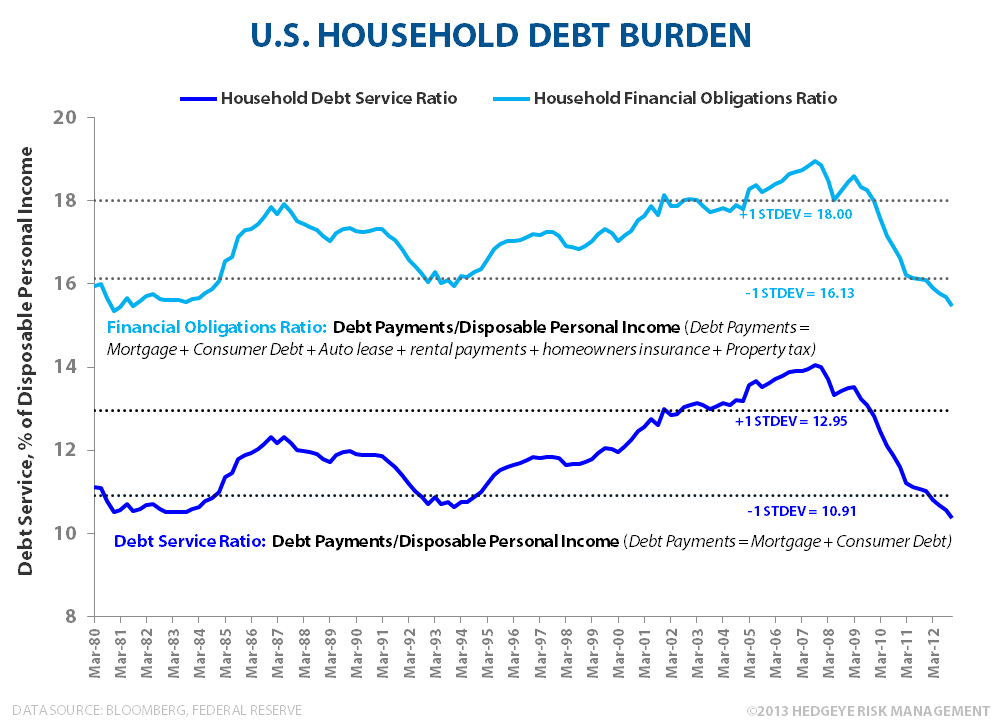
Credit: The Fed’s 2Q13 Senior Loan officer survey showed bank credit standards continued to ease while business and consumer loan demand, particularly for real estate, showed further sequential improvement. Household debt burdens are making lower 30Y lows and household debt and debt ratios have retraced most of the exponential move in debt growth that occurred over the 2000-2008 period.
Ongoing labor market improvement (higher income) alongside rising household net worth (primarily via housing and financial asset re-flation), should continue to support incremental debt capacity while the flow of net new credit looks favorable for credit catalyzed private consumption over the intermediate term.
So, legitimate upside for the dollar still exists, labor markets trends remain positive, housing remains in the middle innings of a secular upswing, and the household income statement and balance sheet recovery remains ongoing alongside favorable consumer and commercial credit trends.
Obviously, we could conjure up some bearish data points to counter some of the bullish dynamics we outlined, but employment/housing/consumption/credit have been key items of focus and key drivers capable of catalyzing positive reflexivity in the economic cycle.
At present, trends across those metric remain positive and supportive of a bullish tilt towards consumption oriented domestic exposure….at a price.
To clumsily bring this missive full-circle, conventional lullabies did little to placate my teething 6-month old last night. What finally put her sleep?...Chewbacca and a 2:30am Star Wars re-run that came on accidentally when she knocked the remote onto the floor.
Lesson? Embrace Uncertainty - today’s market teething births tomorrow’s Chewbacca P&L opportunity. Life, risk, and opportunity happen fast. If fast isn’t your thing….
I hear Hedgeye made the Kessel Run in less than 12 parsecs.
Our immediate-term Risk Ranges for Gold, Oil (Brent), US Dollar, EUR/USD, USD/YEN, UST 10yr Yield, VIX, and the SP500 are now $1370-1446, $101.14-105.44, $83.04-84.43, $1.28-1.30, 100.65-103.78, 1.83-1.99%, 12.33-13.86, and 1636-1662, respectively.
Sleep tight.
Christian B. Drake
Senior Analyst