This note was originally published May 22, 2013 at 11:14 in Financials
Inventory "Green Shoots"
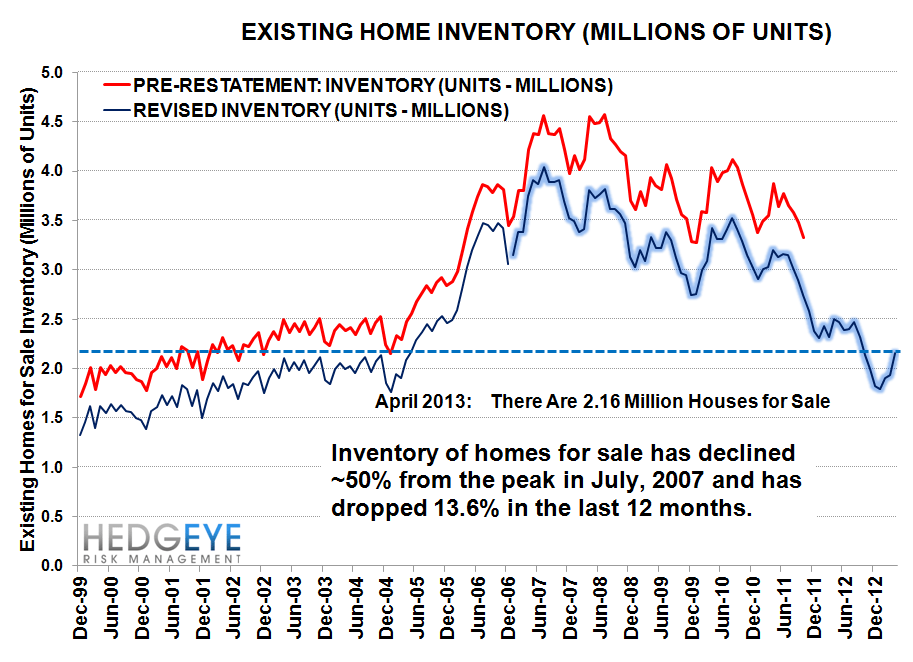
One of the gates on volume upside in housing is a lack of inventory. We're starting to see indications that that constraint may be easing.
The number of existing homes for sale in April rose to 2.16 million, an +11.9% increase vs. March's inventory of 1.93 million. For perspective, the average April MoM change from 2007-2012 has been +9.1%, and today's +11.9% print is the largest we've seen since 2006.
Inventory growth of existing homes for sale grew in April at its fastest rate since 2007. This follows a March increase in inventory that was +1.6% MoM, which was 310 bps ahead of the 2007-2012 average change of -1.5%. So in the last two months, we've seen increases above trend of 310 bps and 280 bps, respectively. In other words, inventory is creeping back. Another way of framing this is to look at the YoY trend in inventory. April inventory is down 13% YoY, but that's a marked deceleration from the 20-25% YoY declines we saw throughout 2012.
The paradox of inventory is that low inventory correlates with rapid price gains, but constrains growth in transaction volume. We suspect the recent upticks in inventory reflect the falling share of underwater homes amid double-digit home price increases. An inventory recovery is also another sign that the market continues to heal. Rising home prices are continuing to alleviate the pressures of the distressed market through lower loss severity and improved cure rates (i.e. lower frequency).
Home Price Implications
On balance, to the extent this inventory recovery continues, we would expect to see rates of home price appreciation decelerate, though likely only modestly. Inventory is at 5.2 months supply right now, which has historically correlated with future annual home price increases of +9.2%. Alternatively, raw inventory levels of 2.16 million correlate with forward rates of home price appreciation of 8.1% YoY. These rates of appreciation are slightly below current rates, but still very strong by almost any measure.
Overall, this data is consistent with our ongoing bullish stance on housing.
Transaction Volumes
In other news, sales volumes were basically flat in April at 4.97mn units (SAAR) vs. 4.94mn in March. This marks the sixth consecutive month that inventories have been in the 4.9-5.0mn range.


Joshua Steiner, CFA
203-562-6500
jsteiner@hedgeye.com
