Macau table revenue fell 10% y-o-y, very similar to March's 9% decline. The breakdown was also similar with the decline driven by a 14% decline in Rolling Chip revenue, partially offset by a 1% increase in Mass Market. Once again, Rolling Chip continues to face tough comparisons with the liquidity driven, massive growth last year. Those tough comparisons will end in September. Despite the tighter visa restrictions, Mass Market revenue is holding in.
The following are some observations about the property level numbers:
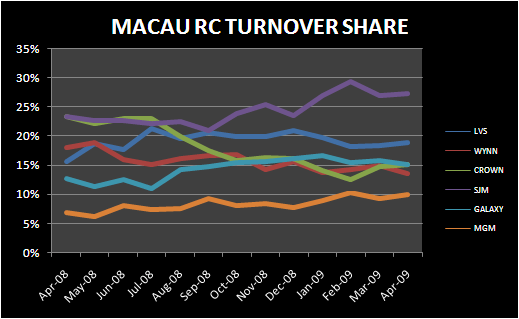
- Wynn: Down to 12.3% from an 12 month average of 16.3%
- Some of the drop on Wynn's share is due to lower hold % in month, but Rolling Chip was also down materially, as was Wynn's Mass Market share
- LVS: Flat from March at 26%
- Rolling Chip was up 5% y-o-y for LVS's properties on a combined basis (Sands was down but Venetian was up)
- MPEL: Crown's market share increased to 9% from 8% last month
- Hold was weak in both March & April, so the share gain was based on better rolling chip volumes
- MGM: Down to 8.4% vs 9.8% last month
- Bad hold was responsible as Rolling Chip was up y-o-y
- Galaxy: Up 2% sequentially from March levels to 12.6%
- Some of the lift is due to better hold
- SJM: Up to 31.7% from 30% in March
Y-o-Y Win comments:
- LVS:
- Sands up 30% driven by an 85% increase in RC with Mass down 11%
- Venetian & FS up 14%
- Total table revenue from Macau + 20% at $253MM
- Wynn:
- Down 36%, with VIP down 38% and Mass down 27%, total table revenue: $120MM
- Crown:
- Down 54%, total table revenue $89MM
- Galaxy:
- Up 17%, with VIP up 30% and Mass down 29%, total table revenue: $123MM
- Growth driven by Starworld which had table revenues grow 49% to $84MM