This note was originally published May 16, 2013 at 14:57 in Financials
Do Starts Matter More than Permits?
Yesterday (Wednesday), after the close, we published a note on why we think it's increasingly likely that housing starts will work their way back to a 2.0 million run rate in the coming years. The timing of that note could have been better, in light of this morning's (Wednesday morning's) 16.5% month-over-month decline in April housing starts. Our view on getting to 2 million, however, is unchanged, and we'd encourage you to take a look at our note when you have a chance. Here's our take on today's data.
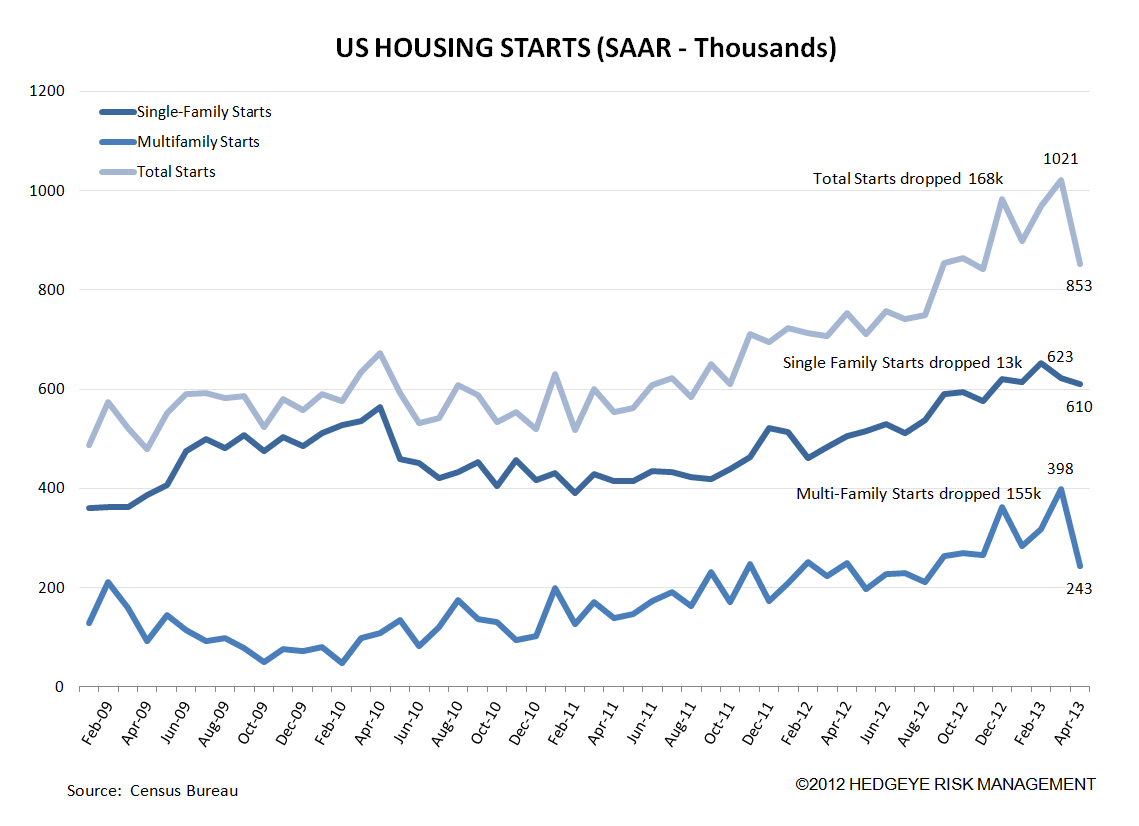
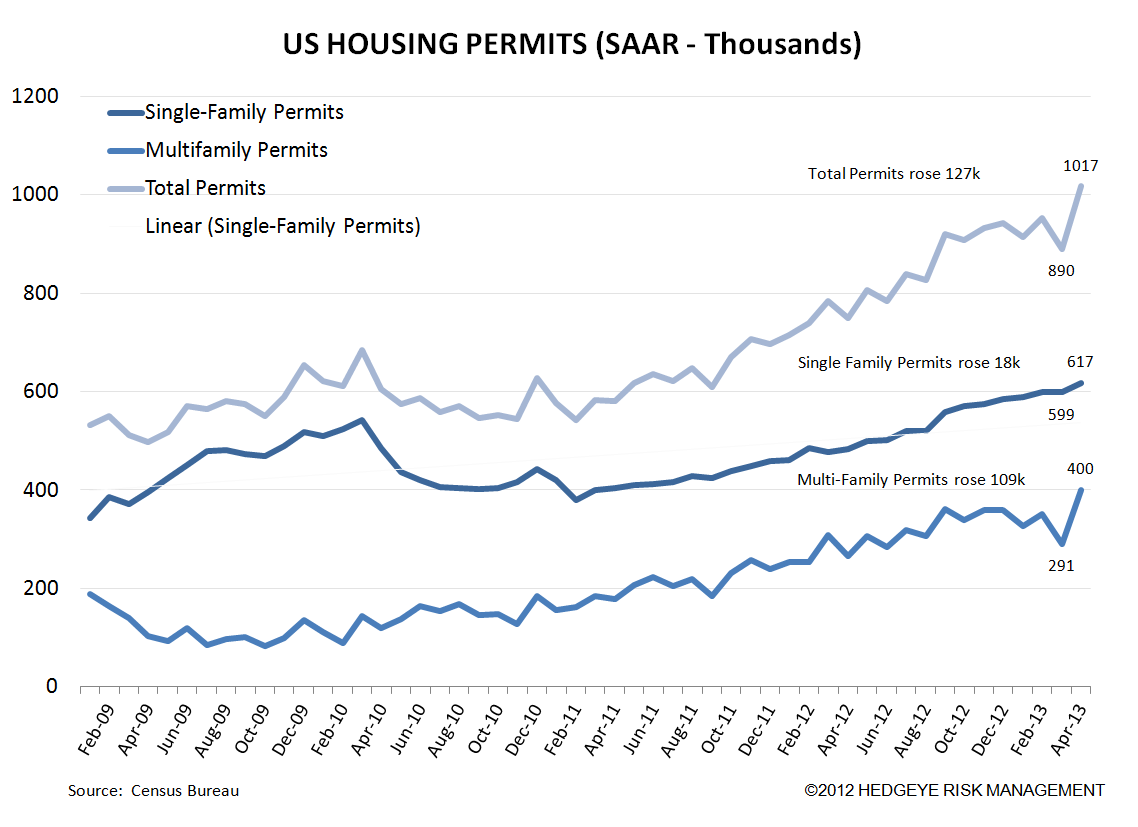
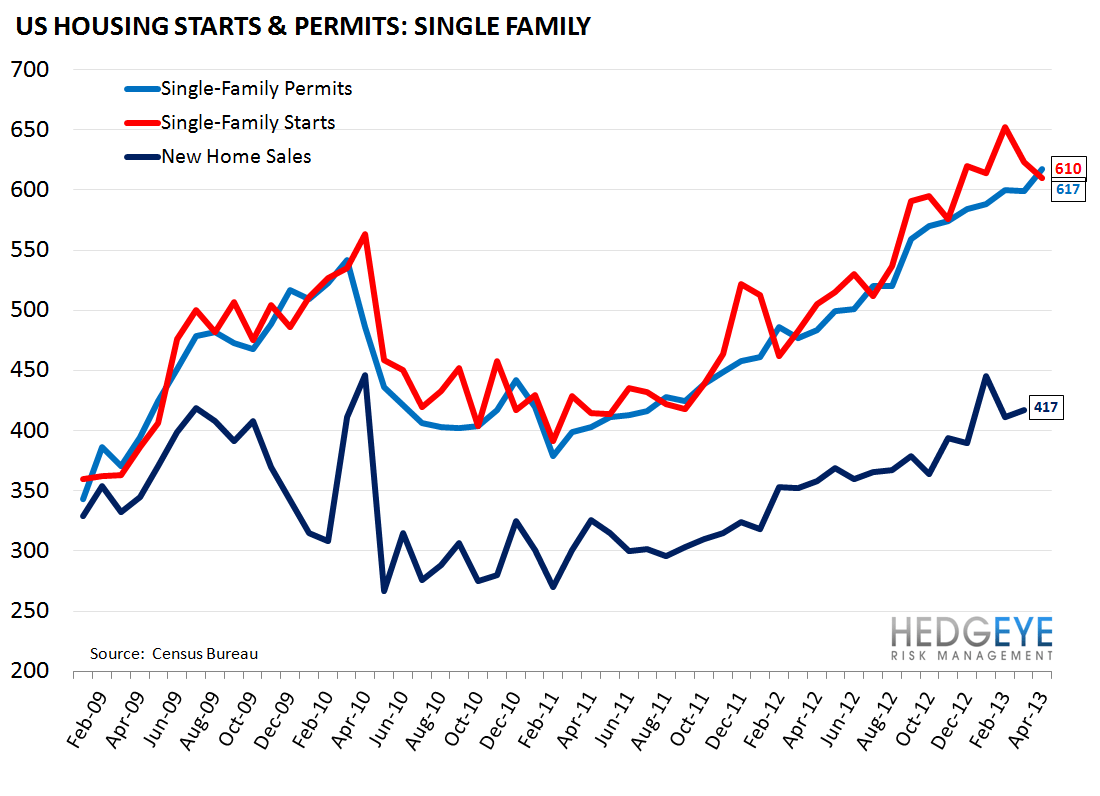
The first point is that the weakness in the starts data this morning was on the multi-family side, where starts dropped 155k MoM. Single family starts fell by 13k to 623k. The second point is that while starts were weak, permits were strong. The second chart shows permits. Single family permits rose 18k MoM while multi-family permits rose 109k. The strength in permits largely offsets the weakness in starts, and the single-family starts/permits dynamic is much less of an "event" than the multi-family data. In looking at the trend lines in the permits chart, we see little cause for concern.
For those curious which is the better indicator, starts or permits, we've looked into this question in the past. It turns out the answer is neither. Our analysis found no discernible lead/lag relationship between starts and permits. We realize it's intuitive that permits lead starts, but in practice they don't. We've run correlations between the series at varying lead/lag intervals and found that the strongest relationship occurs on a no-lag basis.
One interesting consideration, however, is that the Census dept points out that you need only 2 months of permits data to draw conclusions, whereas 4 months of starts data is needed. On that basis, we'd be slightly more inclined to believe the permits numbers.
Here's the full disclosure they provide: In interpreting changes in the statistics in this release, note that month-to-month changes in seasonally adjusted statistics often show movements which may be irregular.
It may take 2 months to establish an underlying trend for building permit authorizations, 4 months for total starts, and 6 months for total completions.