SUMMARY BULLETS:
- Multiples are rising but valuations remain largely benign at current levels while holding a number of key risks. We’re going to continue to risk manage the range with a bullish bias as our TREND research & risk management views on domestic consumption remain constructive. Stick with what’s been working.
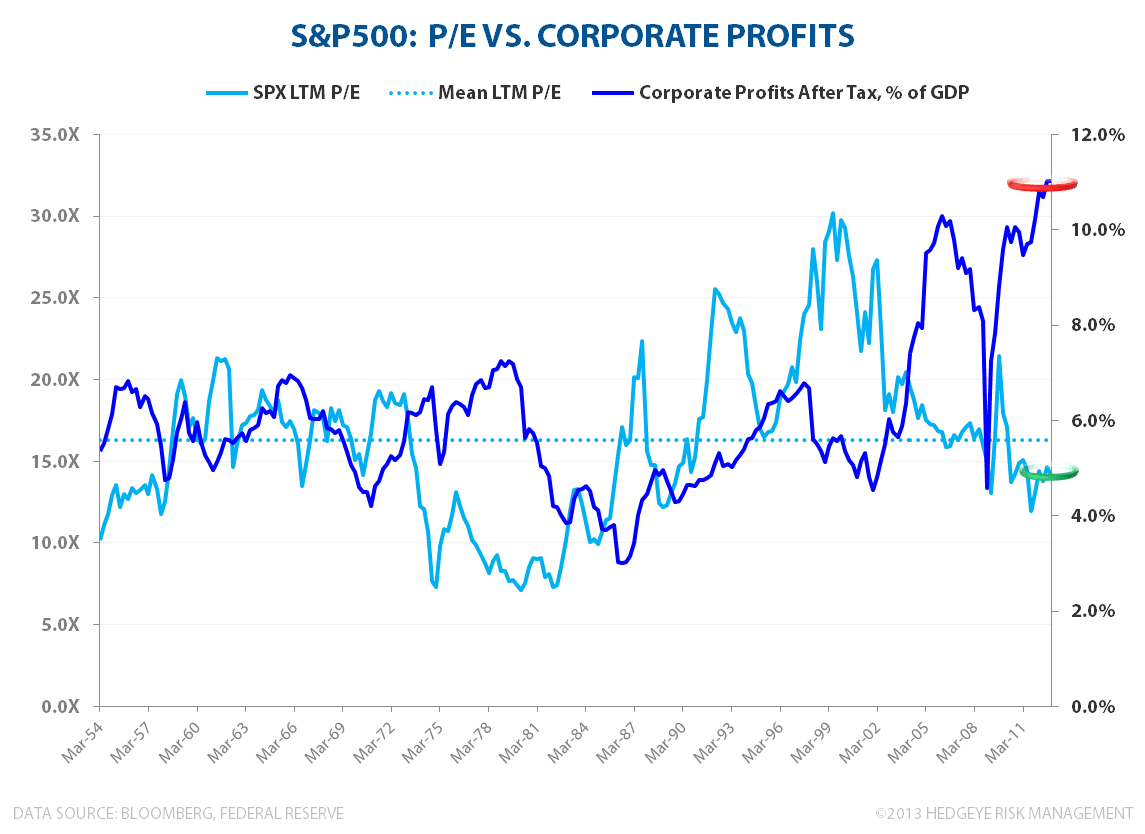
- PEAK MARGINS: Operating Margins & Corporate Profitability remain at peak. Unless you think peak returns to capital are sustainable alongside negative trend growth in real earnings and trough returns to labor, then the mean reversion risk for margins remains asymmetrically to the downside
- CAPE Valuation: At 24.6, the CAPE ratio is moving towards the high end of the range. Expensive could get more expensive over the immediate/intermediate term, but historical precedent suggests return expectations should move systematically lower alongside concomitant increases in valuation from here.
- Estimates: Topline growth for the SPX doesn’t look out of bounds under a scenario of accelerating housing/employment/consumption growth. However, the slope on earnings growth over the NTM continues to look aggressive given the expectations for further margin expansion embedded in those estimates.
- P/E: On conventional LTM & NTM P/E metrics, the market isn’t particularly expensive at present. However, investors should contextualize any superficial market ‘cheapness’ within the construct of corporate profitability levels that are roughly 80% above the historical average.
HEDEGYE PROCESS REDUX: Contextualizing Our Current Positioning
If you’ve followed Hedgeye for any significant period of time it has likely been clear that, from an Investment decision making perspective, valuation sits somewhere near the middle-bottom of the our consideration hierarchy. In fact, you’d probably find the “valuation is not a catalyst” mantra somewhere in our Risk Management Manifesto if such a document existed.
However, if valuation is, indeed, compelling and there is a discrete catalyst on the timeline, then it gets more interesting. Layer on a positive quantitative signal from our risk management model such that the risk management (price signal) and the research view are aligned and an idea gets actionable.
The prices rule and duration agnostic (TRADE/TREND/TAIL) structure anchoring the Hedgeye model is our evolving attempt to develop an investment research process that successfully functions outside of the legacy construct of management one-on-one’s, recycled expert opinion, and valuation-in-isolation and intuition driven decision making. This basic investment approach allows us to operate within the empirically obvious reality that cheap can get cheaper and expensive can get expensive-er from a valuation perspective.
Yesterday served as an illustrative case-study in how the model works in practice. From a TREND perspective, we’ve have been outspokenly bullish on #StrongDollar. With a strong $USD (driven by positive domestic macro data and incrementally hawkish fiscal & monetary policy) as a primary causal factor – we’ve have been bearish on gold & commodities and bullish on domestic, consumer facing equity exposure.
Do we still hold that view? Yes, but from a price.
Yesterday our risk management model was signaling the $USD and SPX overbought, gold oversold, and a relatively high probability that the jobless claims numbers would fail to comp the outsized acceleration (improvement) observed in each of the last two weeks - so we reduced our gross exposure and tightened up our net exposure a bit.
So, in brief, our prices-based Risk Management process drives our allocation and invested positioning while complimentarily functioning within the construct of our TREND research view.
From here, so long as our constructive views on the dollar/housing/consumption remain positive, we can cover shorts and buy back the same exposures we sold yesterday as we move towards the Hedgeye 1633 line on the S&P500 on any sell-off.
That protracted preamble aside, where do we sit currently on market valuation and expectations?
VALUATION: CAPE P/E
We use a broad range of valuation and sentiment indicators when contemplating the direction of markets and where our view sits in the context of current prices, consensus estimates, and prevailing sentiment. Taking a TREND/TAIL view of valuation, Yale Professor Robert Shiller’s methodology serves as a reasonable method for contextualizing current market valuation.
By way of background, Professor Shiller uses what is called CAPE, or Cyclically Adjusted Price to Earnings. In terms of the numerator, or price, Shiller uses the monthly average of daily closes for the SP500. To derive the earnings data, in this instance the denominator, Professor Shiller uses the quarterly earnings data from the SP500’s website and utilizes an interpolation to provide earnings data by month. He then adjusts both the numerator and denominator for inflation using CPI from the Bureau of Labor Statistics. Finally, the inflation adjusted price is divided by an average of ten years of real monthly earnings to determine the CAPE.
Below we’ve broken the historical CAPE ratio values into deciles and looked at subsequent, average market performance across various durations. We would highlight a few takeaways:
- Currently: At the latest value of 24.6, we are currently at the top end of the 8th decile. In other words, over the last 113 years, the CAPE has been lower ~90% of the time. We would note however that the current value is near average for the past 30Y’s inclusive of peak, tech bubble valuation.
- Near-term Performance: If the idea that expensive can get more expensive and vice versa is valid, we would expect to see a more diffuse, random distribution in subsequent performance over shorter-term durations and an increasingly less random distribution over longer term durations. Put differently, the distribution should reflect a more equal tendency of going both higher or lower in the short-term regardless of the CAPE value. This is, in fact, what we observe when looking at subsequent 3M performance relative to subsequent 1Y & 3Y performance. This is reflected in both the trend in average performance by decile (bar charts) as well as the slope of the line in the respective scatter plots below.
- Longer-term Performance: Over the longer-term, CAPE valuation is inversely related to subsequent longer-term performance. As can be seen, for each decreasing decile change in CAPE, subsequent 1Y and 3Y performance generally shows a discrete step function lower in average return.
In short, with the current CAPE ratio in the middle-high range on a historical basis, we could certainly go higher (or lower) in the more immediate term. However, from a longer-term perspective, historical precedent suggests return expectations should move systematically lower alongside concomitant increases in valuation from here.


PEAK MARGINS, PANGLOSSIAN ESTIMATES & IMMEDIATE-TERM INDIFFERENCE
On a conventional trailing or forward P/E basis, the market isn’t particularly expensive at current levels. With global fund flows out of EU and EM markets continuing to target U.S. assets and equities benefiting from downside asymmetry in fixed income and strong dollar driven rotation out of metals and commodities broadly, multiples could certainly absorb another turn or two. As equity prices inflate, we continue to see two key risks:
Peak Margins & Corporate Profitability: We remain at peak operating margins and peak profitability with after-tax corporate profits as a % of GDP at an all-time high. Unless we’ve entered a sustained new normal in terms of corporate profitability and returns to capital (which also implies a new normal trough for returns to labor), the mean reversion risk for margins should remain asymmetrically to the downside with earnings negatively levered to any deceleration in topline trends – a dynamic that is likely to remain in place over the intermediate term. So, investors should contextualize any superficial market ‘cheapness’ within the construct of corporate profitability levels that are roughly 80% above the historical average.
Estimates: While multiples, on a historical basis, aren’t overly stretched here despite the expedited advance over the last six months, as always, valuation based panglossian market narratives are only as good as the growth expectations embedded in the denominator.
Consensus expectations for the S&P500 over the next four quarters look mixed across operating metrics. Topline comps ease through the balance of the year and growth estimates in the low to mid single digits for the SPX appear reasonable under a scenario of accelerating housing/employment/consumption growth. However, the slope on earnings growth over the NTM continues to look aggressive, despite easy comparisons, given the expectations for further margin expansion embedded in those estimates.


Christian B. Drake
Senior Analyst
