Summary Bullets:
- Loan Demand: Commercial and Residential Real Estate demand continues to improve. C&I loan trends remain positive but decelerated in 2Q.
- Credit Standards: Credit Standards across Commercial & Consumer loan categories continue to ease. Given rising demand, improving macro, & the pro-cyclical nature of bank credit policy, further credit standard easing is likely.
- Household Debt: Household Debt/GDP has retraced most of the exponential move in debt growth over the 2000-2008 period. Meaningful downside remains to the long-term average, but we’re currently just north of trend growth.
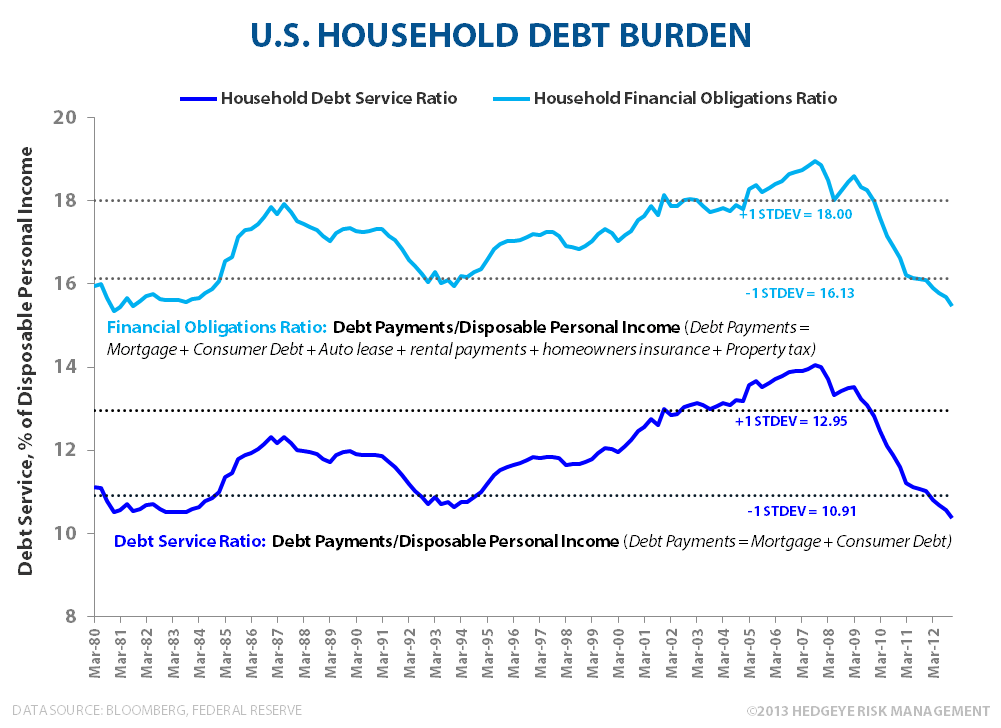
- Debt Service: Household debt service ratio’s continue to decline, making new 30Y lows in 4Q12.
- Debt Growth/Credit Impulse: The decline in debt growth has decelerated and is set to turn positive in 2013. The Credit impulse (Flow of Debt) should remain supportive of consumption in the intermediate term.
- Savings Rate: Despite Household deleveraging and a lower debt burden, negative-to-flat real wage growth and tax law changes have continued to drive the trend in personal savings lower.
- Debt Capacity: Ongoing labor market improvement (higher income) alongside rising net worth (higher collateral values), primarily via housing and financial asset re-flation, should continue to support incremental debt capacity.
- Corporate Margins: Corporate Margins and after-tax Corporate profits as a % of GDP are both at Peak. Current market valuation and multiple upside should be understood within the context of that risk.
DOMESTIC CREDIT: THE VERY TOP DOWN VIEW…Simple Can Dictate the Trend
From a Long-cycle and very Top Down perspective the underlying drivers of credit are fairly straightforward. As Ray Dalio and Bridgewater have highlighted, and would we agree, fundamentally, a lender needs to believe 1.) they have a reasonable chance of being paid back an amount greater than the rate of inflation and 2.) that they will be paid back with dollars of similar purchasing power. Given where we are in the cycle, this simplified approach can help explain much of the directional trend in household credit.
Into and out of the financial crises, credit tightened as lender’s were justifiably worried that debtor’s wouldn’t be able to repay obligations or generate required returns on capital and, with the fed in full easing mode, it was also exceedingly uncertain that the purchasing power of the dollar would hold. With the domestic macro data showing sustained, albeit modest, improvement and the Fed turning more hawkish on the margin, both credit and currency devaluation risk continue to reverse.
Incomes are rising as employment continues its slow grind higher, household debt and debt service ratio’s continue to decline while household net worth has returned to nominal, pre-crises highs alongside higher savings and real estate and financial asset re-flation.
In short, the drivers of incremental household capacity for credit – rising incomes and asset (collateral) values – drive demand with lending standards and bank credit policy reacting pro-cyclically. Capacity for household credit expansion has improved, loan demand has begun to percolate, and credit standard easing remains ongoing.
In the immediate/intermediate term, the flow of credit should remain supportive of consumption and positive growth in nominal debt could occur alongside a further decline in household debt ratio’s.
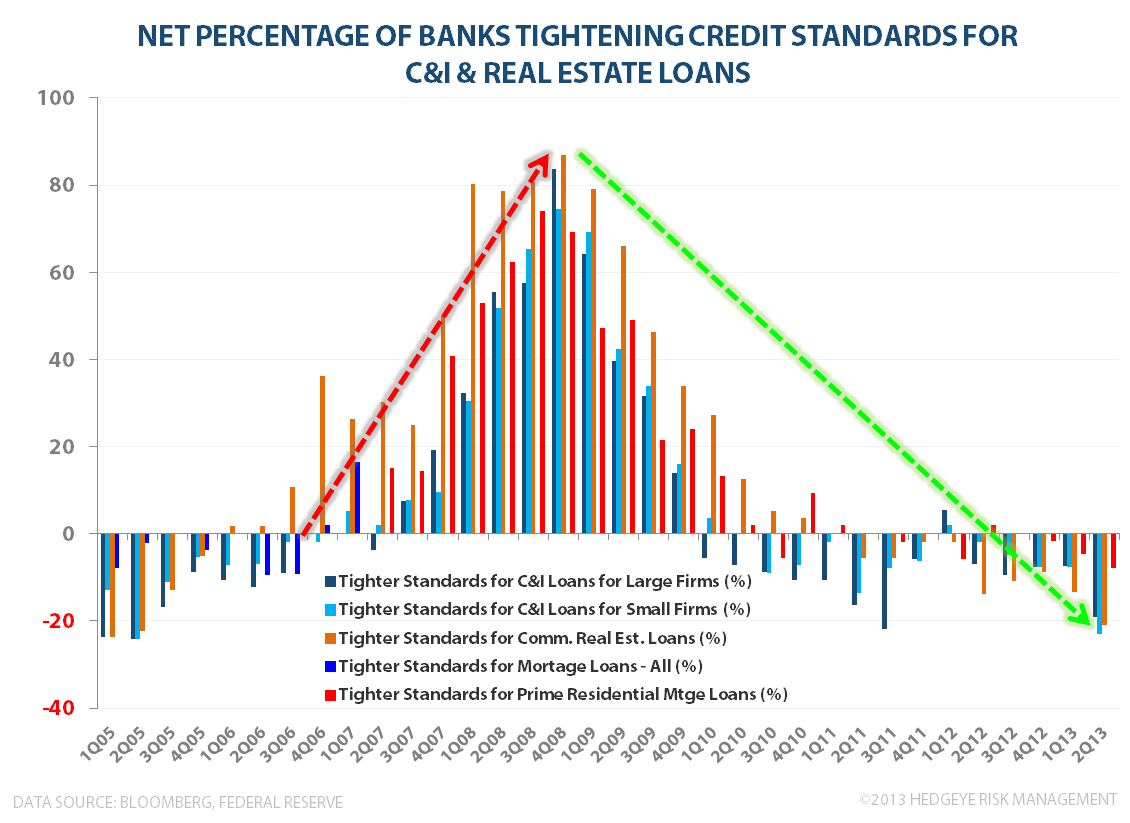
2Q13 Senior Loan Officer Survey: Demand Steady, Credit Standards Ease Further
The Fed released its 2Q13 Senior Loan Officer Survey earlier this week. On balance, the release was positive as lending standards continued to ease alongside pockets of relative strength for loan demand. The Highlights:
Stronger: Net percentage of banks tightening credits standards for Commercial Real estate (CRE) loans in 2Q13 declined -20.9%, the lowest level since the crises, while CRE loan demand remained strong with 40.3% of banks reporting stronger sequential demand. On the Residential Real Estate side, net easing of standards on prime mortgage loans continued with 7.8% of banks reporting lower standards. Home loan demand from prime borrowed rose significantly with (net) 39.1% of banks reporting increased demand.
Weaker: C&I loan demand remained positive but cooled sequentially with banks reporting a net 5.9% increase in demand vs 19.1% in 1Q13.

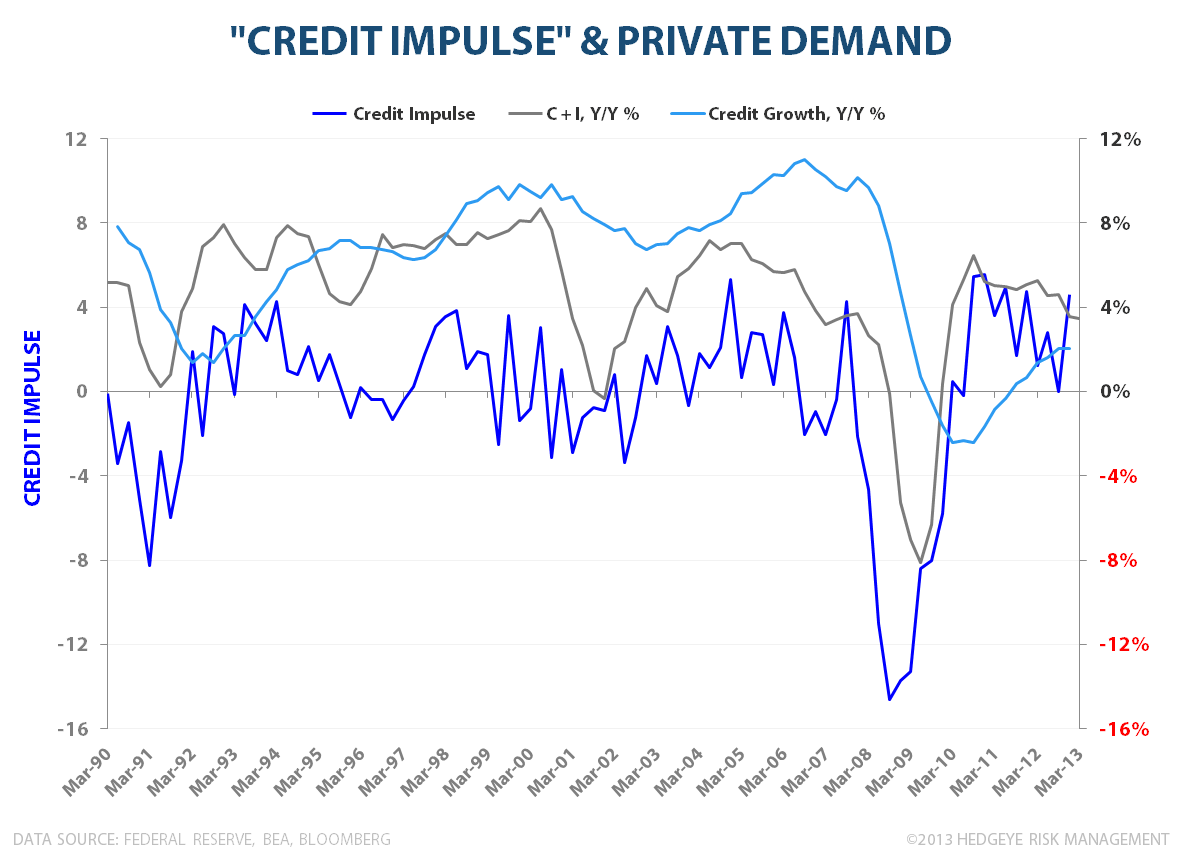
CREDIT FLOW: The idea of the Credit Impulse, popularized by Biggs, Meyer & Pick (2010), centers on the idea that it’s the flow, not the stock, of credit that matters relative to economic growth. The implication is that if the change in net new credit is positive, credit can still support demand even if the nominal stock of total debt is still declining. Put differently, a deceleration in the rate of decline of debt equates to a positive change in net new credit that can give economic activity a boost. By and large, the empirical appears to bear out the theory.
The first chart below illustrates the Credit Impulse (Household and Non-Financial Corporate Debt, Flow of Funds data) vs. the Y/Y change in consumer and business demand (represented by the y/y change for the Consumption and Investment components of GDP) along with the Y/Y change in total household and Non-financial corporate debt. As can be seen, the trend in private sector demand growth tracks the credit impulse closely and leads the positive inflection in y/y debt growth.
The second chart shows the Credit impulse vs. the ‘Banks Willingness to Lend’ measure from the Senior Loan Officer Survey (above). Again, the Trend relationship is strong and with Willingness to Lend accelerating in 2Q13 the read through for credit catalyzed private consumption remains favorable.

Household Debt to GDP: Household Debt/GDP remains in decline as nominal debt continues to fall y/y alongside ongoing, modest GDP growth. We’re currently 16.7% off peak 2009 Debt/GDP levels and while there is still meaningful downside to the long-term average, we’ve nearly retraced back to (1) trend.

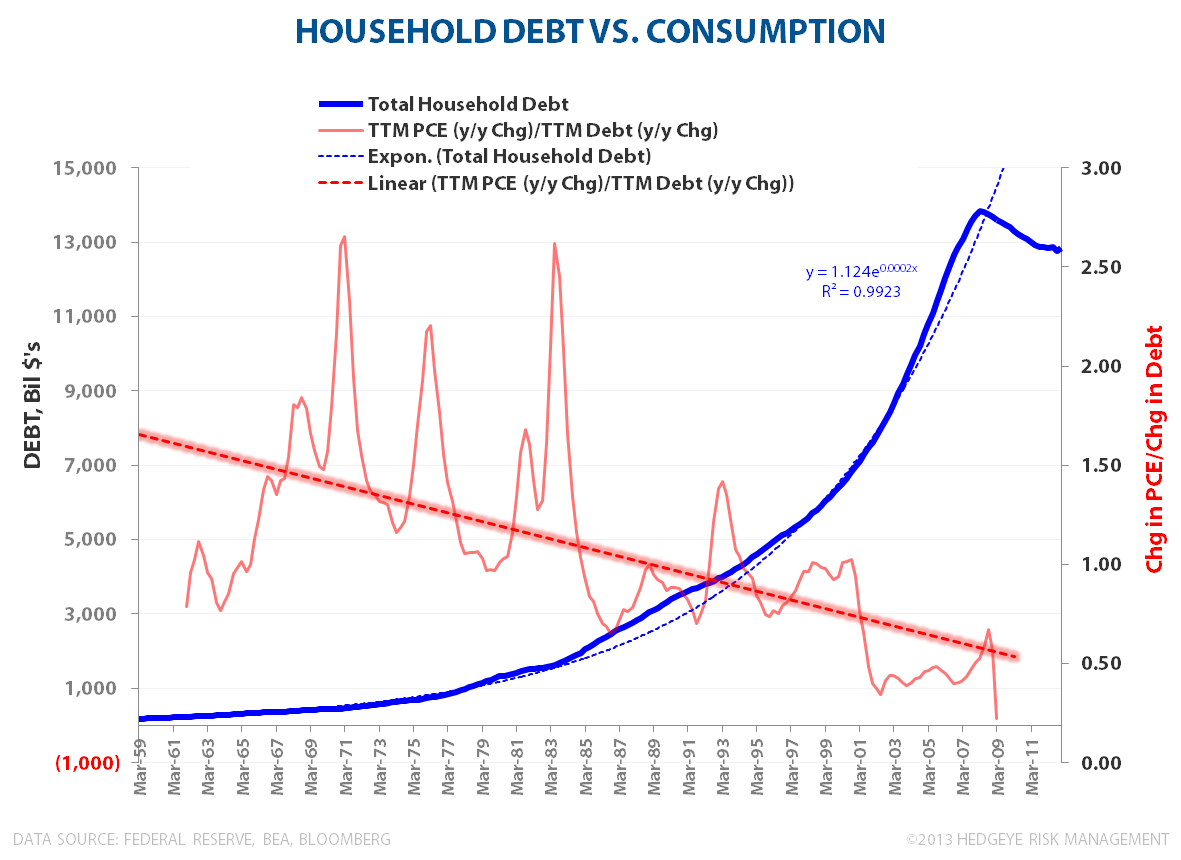
Household Debt vs. Consumption: Beginning in ~2000, growth in Household debt decoupled from household consumption as debt growth went exponential. As growth in household debt accelerated, debt became increasingly ineffectual in driving incremental consumption. That is, marginal consumption declined as a dollar increase in debt drove increasingly less than a dollar increase in consumption.
This dynamic is a typical antecedent of financial crises whereby incremental debt is used to speculatively acquire already overpriced (financial) assets instead of going towards entreprenurial or productive output/investment.

Household Debt Burden: Debt Service Ratio’s continue to trend lower due to a combination of organic delevering, low interest rates, and nominal earnings growth. Both the Household Debt Service and Financial Obligation ratio’s made new 30Y lows in 4Q12.
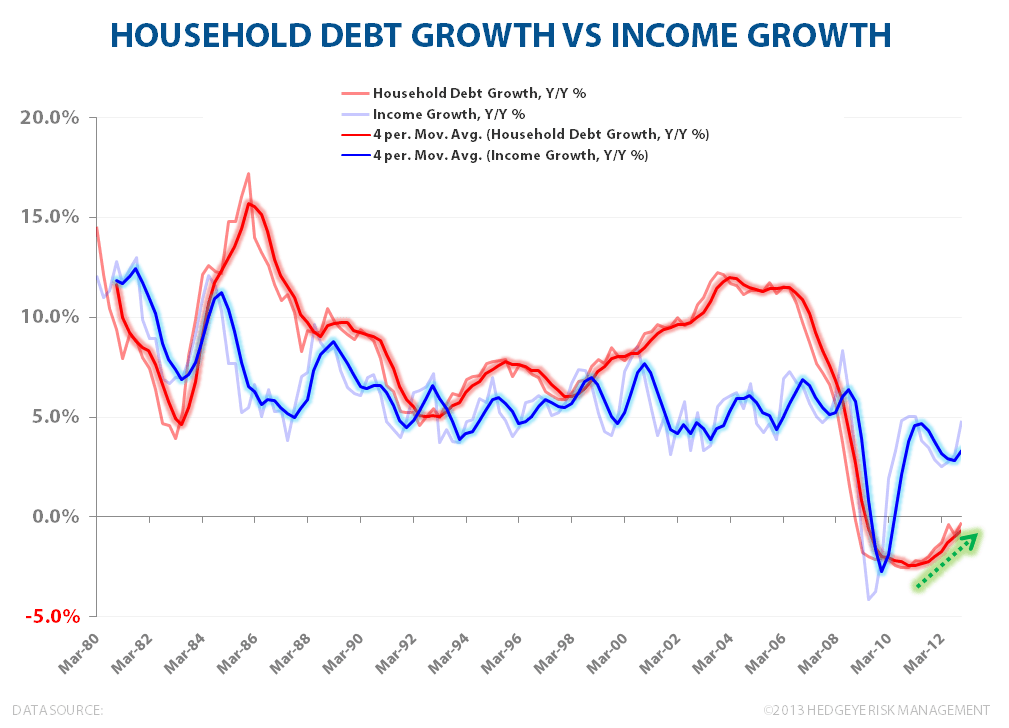
Debt Growth vs. Income Growth: In the long-term debt cycle, debt growth can exceed income growth until debt to income levels reach a critical upper bound at which point cash flows to service debt (income) become inadequate to meet debt service obligations and monetary policy is impotent to help as interest rates cannot be lowered further in support of easing household debt burdens.
In the wake of the financial crisis and through to the present, income growth has run at a positive spread to debt growth. Debt growth has already inflected and given positive mortgage, auto, and consumer loan trends YTD is likely to turn positive in 2013. The closing of the delta between income and debt growth represent the upside to credit driven consumption.
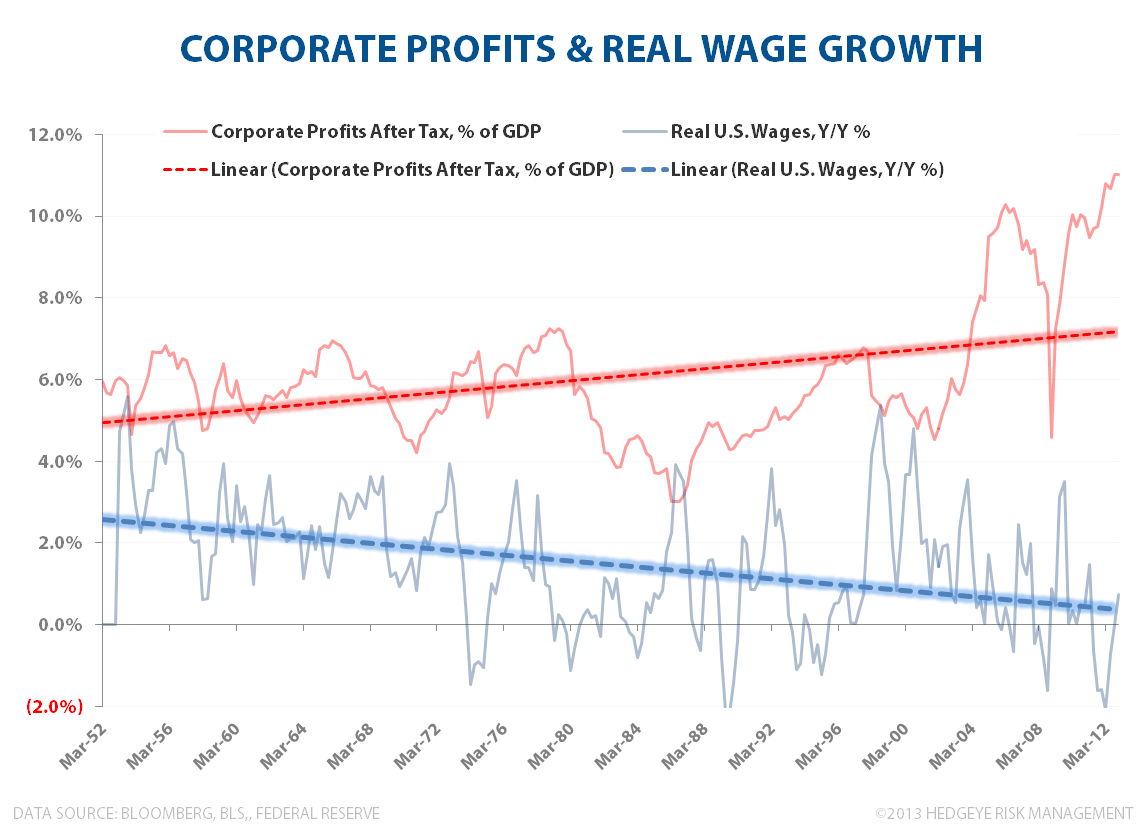
HEADWINDS: Corporate Profits, Real Wage Growth & Personal Savings…and a Valuation Reminder
Peak corporate earnings as a % of GDP, trend deceleration in Real Wages and a trough in Labor’s Share of national income obviously aren’t supportive of aggregate demand acceleration and credit expansion longer-term.
Despite Household deleveraging and a lower debt burden, negative-to-flat real wage growth and tax law changes have continued to drive the trend in personal savings lower. Higher payroll taxes in 1Q13 had a discrete impact on personal savings as individuals reduced savings to maintain consumption in the face of higher taxes.
A quick valuation reminder as it relates to peak returns to capital - while the SPX isn’t particularly expensive on a historical basis, its important to contextualize that “cheapness “ within the construct of peak margins and mean reversion risk to peak corporate profits.


Christian B. Drake
Senior Analyst
