Singapore’s gaming revenues declined 3% YoY in Q1 2013 to S$2BN as market hold was 2.32%, compared with 3.48% in Q1 2012. Market hold since Q2 2010 (MBS opening) has been 2.87%. If we use 2.87% to normalize VIP revenues in Q1 2013 and Q1 2012, GGR would have been S$2.25BN, up 20% YoY.
Rolling chip volume growth hit 39% YoY in Q1 2013 to S$43.7BN (US$35.5BN), continuing the momentum from the 53% surge seen in Q4 2012. By comparison, Macau RC volume in Q1 2013 grew only 4% YoY to US$220BN.

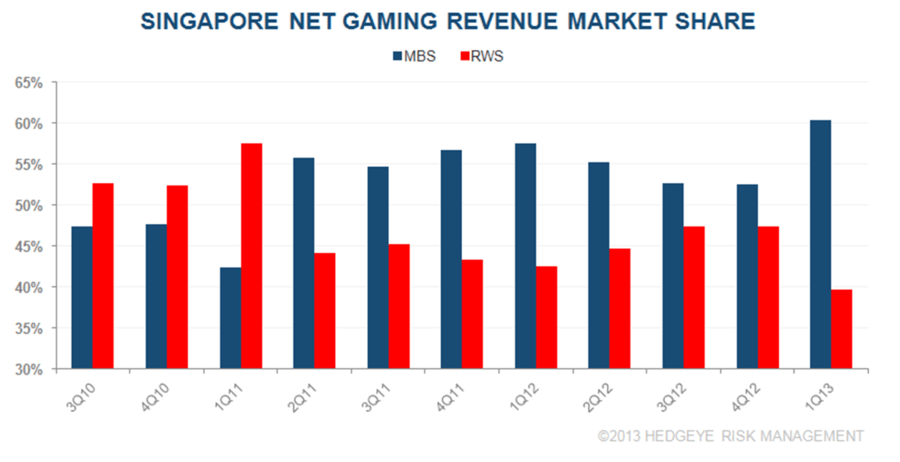
MBS gained 8% points QoQ in net gaming revenue share to 60.3%, a new high.
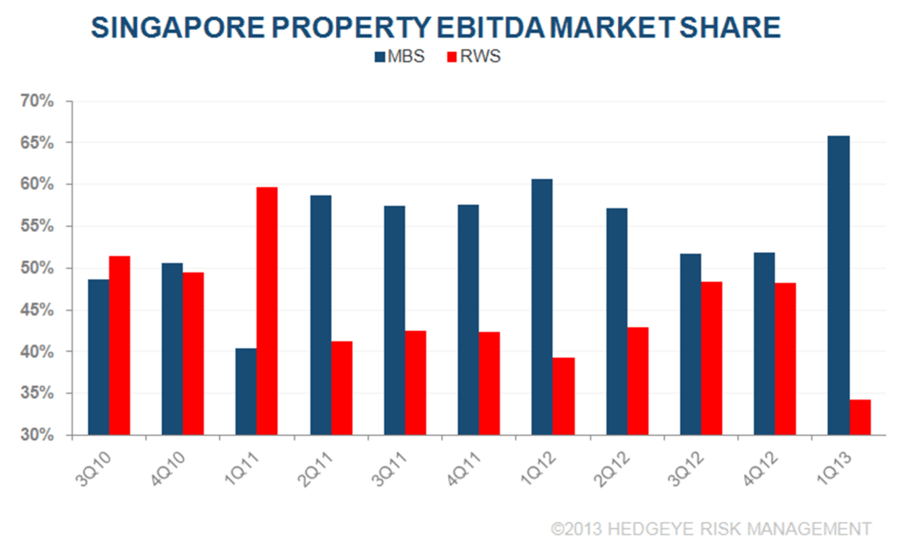
Total property EBITDA experienced its 4th consecutive YoY decline to S$747 million, falling 24% YoY. MBS’s EBITDA share jumped 14% points QoQ to 65.8%.
Mass revenue was up 5% YoY as hold reached 23.80% (hold in 1Q 2012 was 22.49%). RWS gained 2% points QoQ in share to 52.4%.

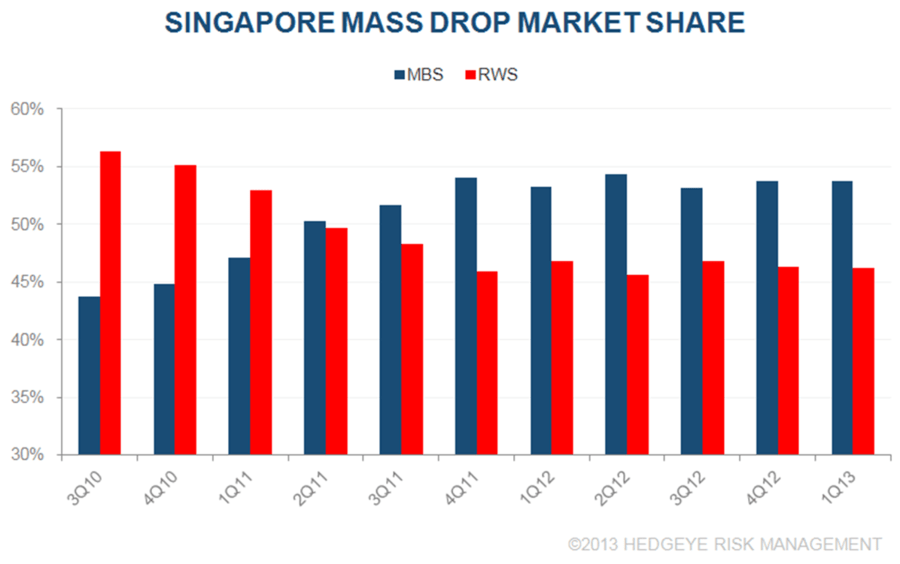
Mass drop fell for the 3rd consecutive quarter YoY, declining 1% to S$2.75 BN. Market shares were roughly unchanged QoQ. In general, Mass market drop has been range bound from S$2.5-$2.8 BN since 2Q 2010.
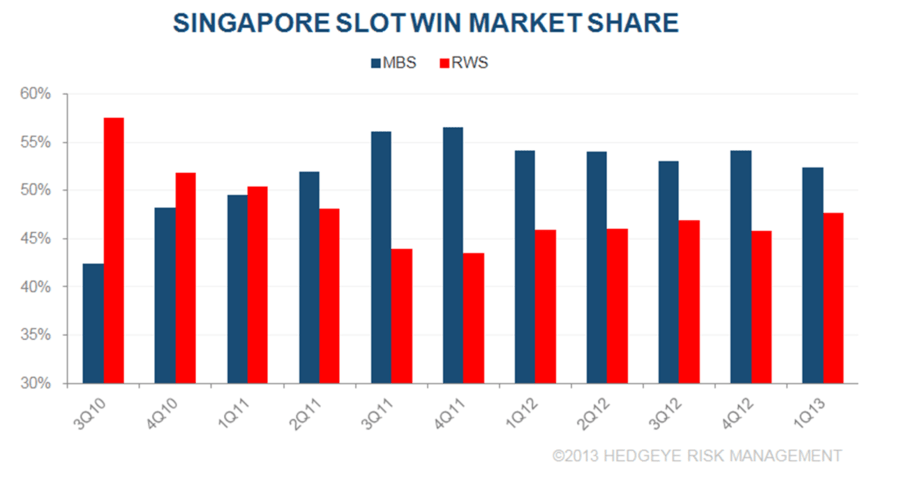
Slot win slipped 3% YoY to S$336 and slot win per slot per day fell 4% YoY to S$733. RWS gained 1.8% QoQ in slot win share.