The April Payroll data improved sequentially, confirming the acceleration observed in the NSA Jobless Claims numbers in recent weeks. Private and Nonfarm Payrolls both improved sequentially, the Unemployment Rate dropped to 7.5% alongside accelerating job growth across most age demographics, Temp employment growth accelerated and State & Local government employment growth continued to improve. Notably, the February & March NFP estimates saw a large positive revision with Feb revised from +268K to +332K and March revised from +88K to +138K for a combined 2M revision of +114K.
Below we revisit the idea of seeing a 6-handle in unemployment in 2013 and provide a summary review of the April employment trends observed across both the Current Population Survey (Household Survey), which drives the Unemployment Rate, and the Establishment Survey (CES) which drives the NFP Number.
6-Handle? Back in January, we examined the extent to which the variables driving the unemployment rate would have to move to push unemployment below 7% over 2013 (Will We See 6.5% Unemployment in 2013? ). The early conclusion was that while a sub-7% unemployment rate probably wouldn’t represent our baseline case, we wouldn’t view it as a tail probability either.
So, where do we stand currently?
Over the last 4 months, we’ve followed a path that pushes the probability a little closer to the heart of the curve. If we make the simplifying assumptions of stable population growth and a static Labor Force Participation Rate from here (the lowest level since May of ’79), we need to average net payroll adds of 233K/mo over the next 8 months to breach 7% on the downside in December.
If we use Nonfarm Payrolls as our proxy for monthly employment gains (note: the unemployment rate is determined using the Households survey of employment. The Household & Establishment survey, which produces the NFP number, can vary considerably on a month to month basis, but tracked closely on a trend basis) year-over-year growth would need to average ~1.85% over the balance of the year. With NFP employment growth averaging 1.58% and 1.62% over the last 6M and 12M, respectively, this equates to ~25bps acceleration from current levels.
Is a moderate acceleration in employment growth probable from here in the face of a negative seasonal distortion, a well-advertised fiscal policy drag and a slowing EU/China? Similarly, can we expect the marked (arguably surprising) accelerating improvement in the Initial claims data to extend itself further? I don’t know.
Economies are certainly reflexive and three important components – Labor, Housing, & Confidence – all continue to accelerate while household debt and debt service levels continue to decline. With the U.S. macro data looking good on an absolute basis, better than good on a relative basis, and equities in Bullish Formation from a quantitative Risk Management perspective, we’re continuing to manage gross and net exposure with a bullish bias towards domestic consumption oriented sectors and equities. We currently positioned 10 Longs, 4 Shorts in our Real-time Alerts with immediate term upside to 1626 in the SPX.
Non-Farm Payrolls (Establishment Survey): NonFarm Payrolls rose 165K in April on expectations of 140K and 88K prior with y/y growth accelerating 10bps sequentially to +1.6%. Private payrolls rose 176K on expectations of 150K and 95K prior (revised from 246) with y/y growth accelerating 5bps sequentially to +1.9%. Notably, the February & March saw significant positive revisions with Feb revised from +268K to +332K and March revised from +88K to +138K for a combined 2M revision of +114K.
Household Employment: BLS’s Household survey of employment showed total employment increased 293K sequentially with y/y employment growth accelerating 30bps sequentially to +1.3% y/y.
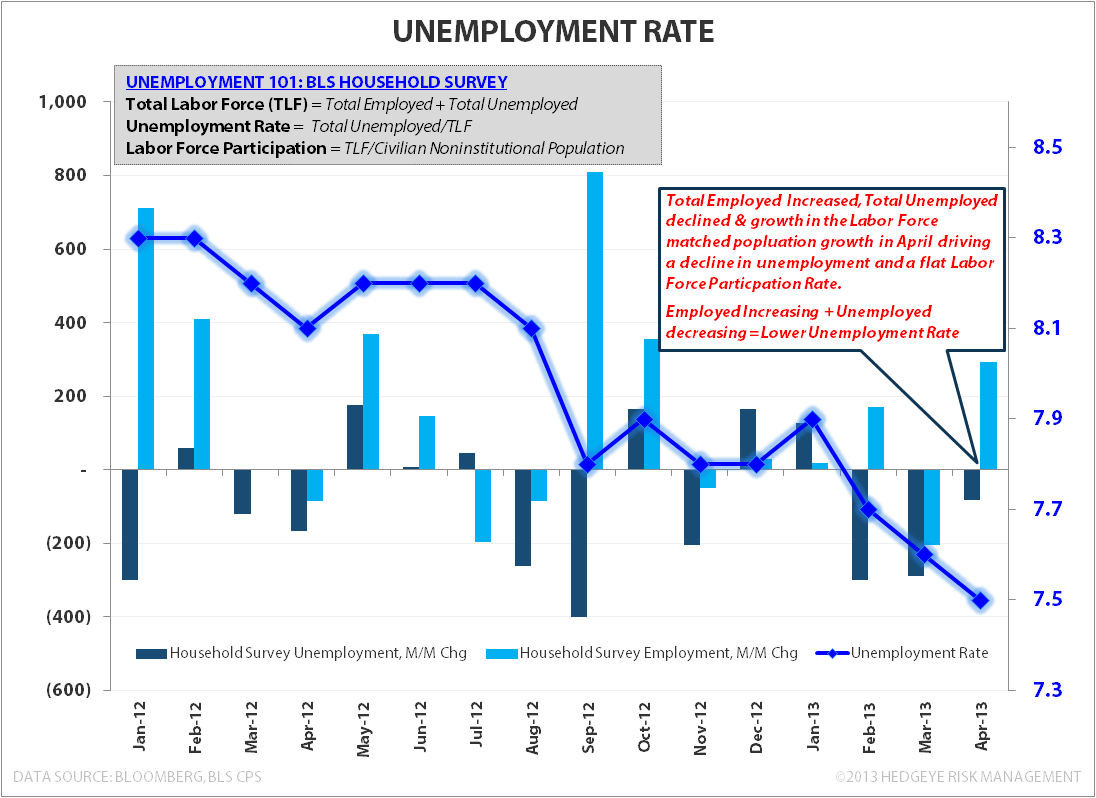
Unemployment Rate: The Unemployment rate dropped to 7.5% from 7.6% m/m. With Total Employment rising +293K and Total Unemployed declining -83K the dynamics driving the change in the unemployment rate improved vs. March where the decline was principally a function of the total unemployed (-290K) declining more than the decline in employed (-206K).
Labor Force Participation: The Labor Force Participation rate (LFPR) was essentially flat, ticking up to 63.32% in April vs 63.28% in March, holding at the lowest level since May of 1979. As a reminder, the LFPR = Total Labor Force (Employed + Unemployed)/Civilian Non-institutional Population. The Civilian non-institutional population was up +180K m/m (+1.0% y/y) while the total Labor Force rose by 210K (+0.5% y/y). A positive denominator and a slightly more positive numerator = a marginal increase in the Labor Force Participation Rate.
Employment By Age: With the exception of the 25-34 year old cohort, employment growth across all age buckets accelerated sequentially in April. Of note, and as it relates to our expectation for a recovery in births, employment growth within the key 20-34YOA female demographic remained positive, accelerating 80bps sequentially to 1.3% y/y.
Part-Time & Temp Employment: Part-time employment (household survey) increased 107K m/m while Temp employment (establishment survey) rose 31K in April. While the growth trend in part-time employment remains one of deceleration, growth in Temp Employment accelerated on both a 1Y and 2Y basis in the latest month.
One thing to consider as it relates to a payroll growth over the balance of the year is the potential for accelerating part-time and temp employment. Anecdotally, instances of companies managing labor hours and temp staffing requests for part-time workers are picking up as businesses look to manage costs associated with Healthlaw implementation and the requirement that companies provide health insurance or pay a fine for any employee working at least 30 hours a week. We’ll be taking a closer look at this dynamic to gauge the potential for any notable, prospective impact to employment trends.
State & Local Gov’t Employment: The slow grind higher for state & local government employment, after a four year run of negative growth, continued in April with growth coming in at -0.1% y/y. Aggregate State Tax revenues surpassed the 2008 peak in nominal terms in 2012 with further positive growth expected in 2013. The continued recovery in revenues should be a tailwind for employment and investment, however, sequestration and uncertainty around impending fiscal policy and budget decisions at the federal level may be weighing on hiring decisions at the state/local gov’t level currently.
Average Weekly Hours: Average weekly hours for private employees ticked down to 34.4 from 34.6 in March, declining 0.6% m/m and flat y/y on a sequential basis. We’ll be monitoring the trend here in conjunction with the trend in temp and part-time workers as it relates to businesses managing the SWB line ahead of ACA implementation (described in Part-time Employment section above)
BLS Household Survey Data


BLS Establishment Survey Data


Christian B. Drake
Senior Analyst
