Below is the detailed breakdown of this morning's claims data from our head of Financials, Josh Steiner. If you would like to setup a call with Josh or trial his research, please contact
Back on Track
We realize there are a lot of charts in this note, so in the interest of everyone's time we'll direct you to the two that we consider most important: the first and second.
The first chart shows the illusion. You can see from the bottom right series that seasonally-adjusted initial jobless claims are beginning their steady rise that will continue through August, just as they have in the prior three years. In fact, the slope of the line is steeper than what we've seen in the last three years - a negative sign. As a reminder, we think this dynamic is one of the primary contributors to the recurrent pattern we've seen in the XLF over the last three years. For more on that see our note yesterday "Beware the Ides of April?".
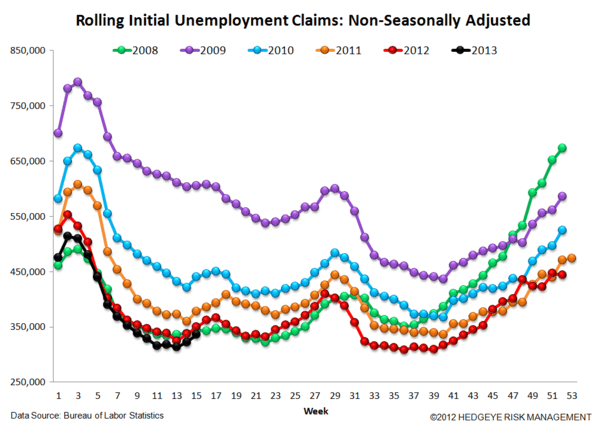
The second chart shows the reality. The reality is that non-seasonally adjusted claims are 4.0% lower than last year, which is right in-line with the trend line of improvement we've been seeing since the recovery began in early-2009. You can see that the slope of the 2013 YTD change is nearly identical with what we saw in 2012.
The takeaway from this is that the market still focuses on the first chart when it should be focusing on the second chart. While we recommend battening down the hatches for the immediate term, we would view weakness as a buying opportunity so long as the second chart remains on track.
The Numbers
Prior to revision, initial jobless claims rose 6k to 352k from 346k WoW, as the prior week's number was revised up by 2k to 348k.
The headline (unrevised) number shows claims were higher by 4k WoW. Meanwhile, the 4-week rolling average of seasonally-adjusted claims rose 2.75k WoW to 361.75k.
The 4-week rolling average of NSA claims, which we consider a more accurate representation of the underlying labor market trend, was -4.0% lower YoY, which is roughly flat with the previous week's YoY change of -4.4%.


Joshua Steiner, CFA