Easter Bunny Distortions
The time shifting of Easter has historically been a notable challenge for the seasonality department at the Dept. of Labor. Looking at the latest two weeks of data, we saw claims spike by 28k two weeks ago and then drop by 39k last week (these are both comparisons vs. the unrevised prior number). On the margin, claims were better by 11k over two weeks.
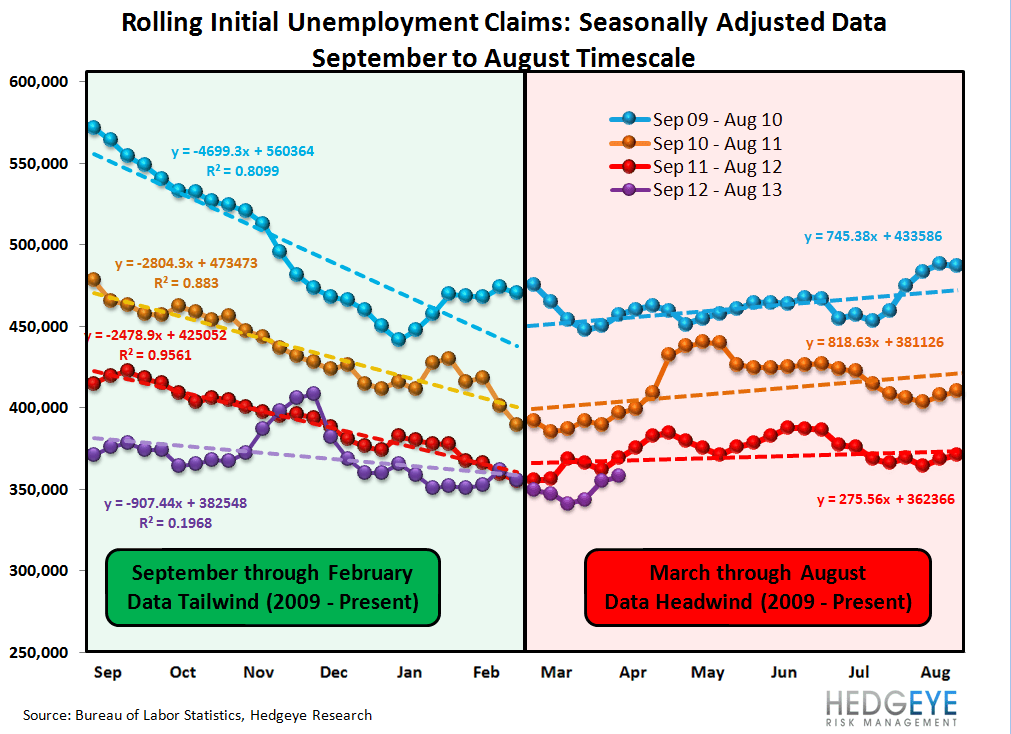
Market cheering aside, the trend in SA rolling claims is fulfilling its destiny. A look at the first chart below shows this plainly. SA claims are beginning their steadily rising path that they'll follow through August of this year. In the last three years this has been a major factor contributing to the sector's turn in the Feb-April timeframe.
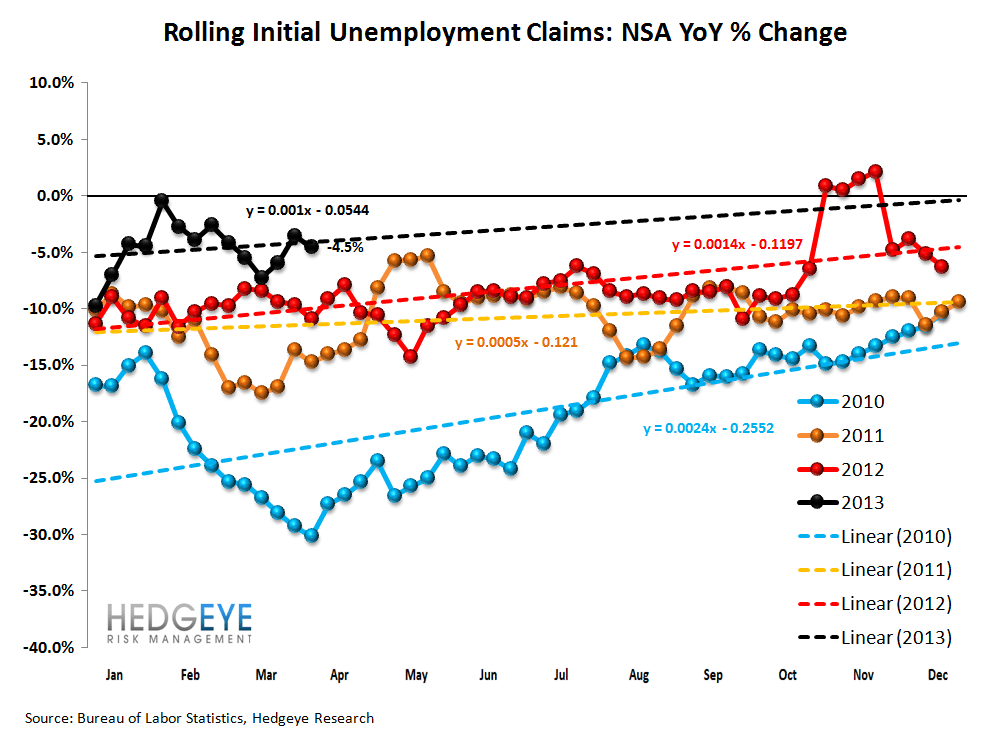
On an NSA basis the data improved. Last week we lamented that the rate of YoY improvement slowed to almost zero. This week, it jumped to -9.3%, one of the strongest prints we've seen in the last six months. Ostensibly, the two should be averaged, producing a blended YoY improvement of around 4-5%, which happens to be precisely what the rolling NSA YoY trend did (-4.5%).
Overall, labor market conditions are holding up well, despite last week's scary headlines. We continue to expec the SA data to deteriorate on the margin over the coming months, but the true, underlying trend is strong.
The Numbers
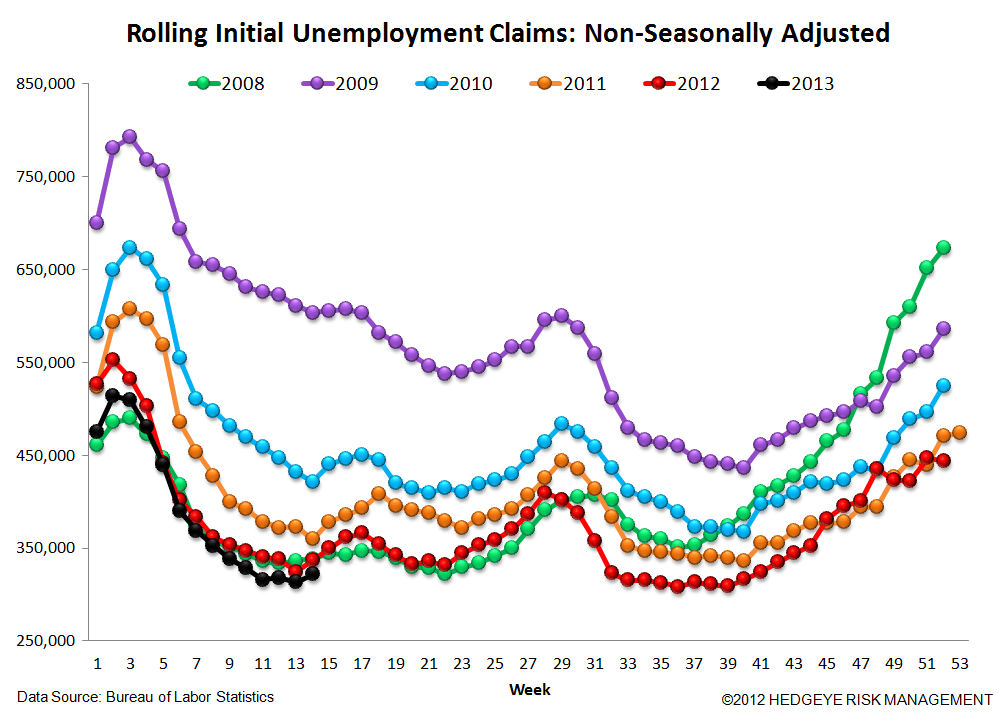
Prior to revision, initial jobless claims fell 39k to 346k from 385k WoW, as the prior week's number was revised up by 3k to 388k. The headline (unrevised) number shows claims were lower by 42k WoW. Meanwhile, the 4-week rolling average of seasonally-adjusted claims rose 3k WoW to 358k. The 4-week rolling average of NSA claims, which we consider a more accurate representation of the underlying labor market trend, was -4.5% lower YoY, which is a sequential improvement versus the previous week's YoY change of -3.5%


Yield Spreads
The 2-10 spread fell -2.0 basis points WoW to 158 bps. 2Q13TD, the 2-10 spread is averaging 156 bps, which is lower by -12 bps relative to 1Q13.


Joshua Steiner, CFA