Clean and Simple takeaway this week - Labor Market Trends continued to accelerate as non-seasonally adjusted initial jobless claims improved to -7.5% YoY as compared with improvement of -5.6% in the previous week. Employment and Housing are now reflecting some virtuous circularity.
Below is the detailed analysis of the claims data from our head of Financials, Josh Steiner. If you would like to setup a call with Josh or trial his research, please contact
Labor Market Strength Shows No Signs of Deterioration
The optical (i.e. SA) claims number was slightly better than expected in spite of rising nominally WoW. Our focus is on the trends in the NSA data, where we saw further acceleration in improvement in the latest week. This past week, the rolling NSA (non-seasonally adjusted) initial jobless claims improved by -7.5% YoY as compared with improvement of -5.6% in the previous week. What this signals is that the real labor market is experiencing accelerating improvement, and this has been the case for the last six weeks. Refer to the second chart in this note for additional perspective.
We think it's also worth noting that the trajectory of 2013 is now mirroring 2012 with a nearly identical slope of +16 bps (vs +14 bps in 2012). This is the strongest leading indicator for housing trends, lender credit quality trends and loan growth trends. Moreover, it raises expectations of the Fed backing off, which pushes the long end higher, alleviating pressure on margins.
On the SA (seasonally-adjusted) front, the numbers also looked good. This is what the market is paying attention to. As a reminder, the SA data is now facing a small, but growing headwind over the coming six months. The first chart in the note tells the story well.
The Data
Prior to revision, initial jobless claims rose 4k to 336k from 332k WoW, as the prior week's number was revised up by 2k to 334k.
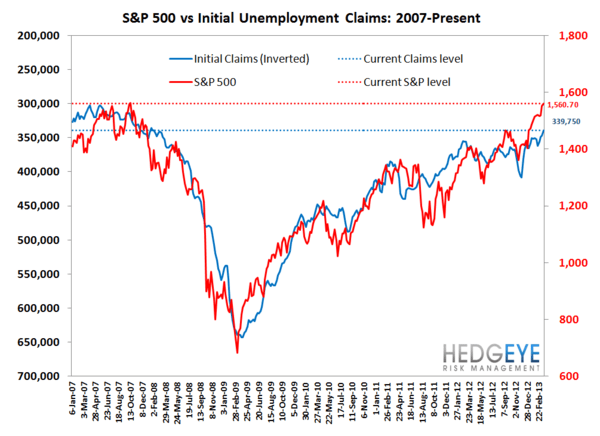
The headline (unrevised) number shows claims were higher by 2k WoW. Meanwhile, the 4-week rolling average of seasonally-adjusted claims fell -7.5k WoW to 339.75k.
The 4-week rolling average of NSA claims, which we consider a more accurate representation of the underlying labor market trend, was -7.5% lower YoY, which is a sequential improvement versus the previous week's YoY change of -5.6%


Joshua Steiner, CFA
Christian B. Drake
