Let's take a look at these two charts below. Our models saw these correlations before they happened.
In the first chart, note the performance of the US dollar versus the S&P 500 in the last few months. You'll notice that as the US dollar moves higher, so does the S&P 500. In fact,did you know the US dollar index is up for the sixth consecutive week? But as with any correlation risk, change can happen fast, so we'll be prepared if and when this correlation changes.

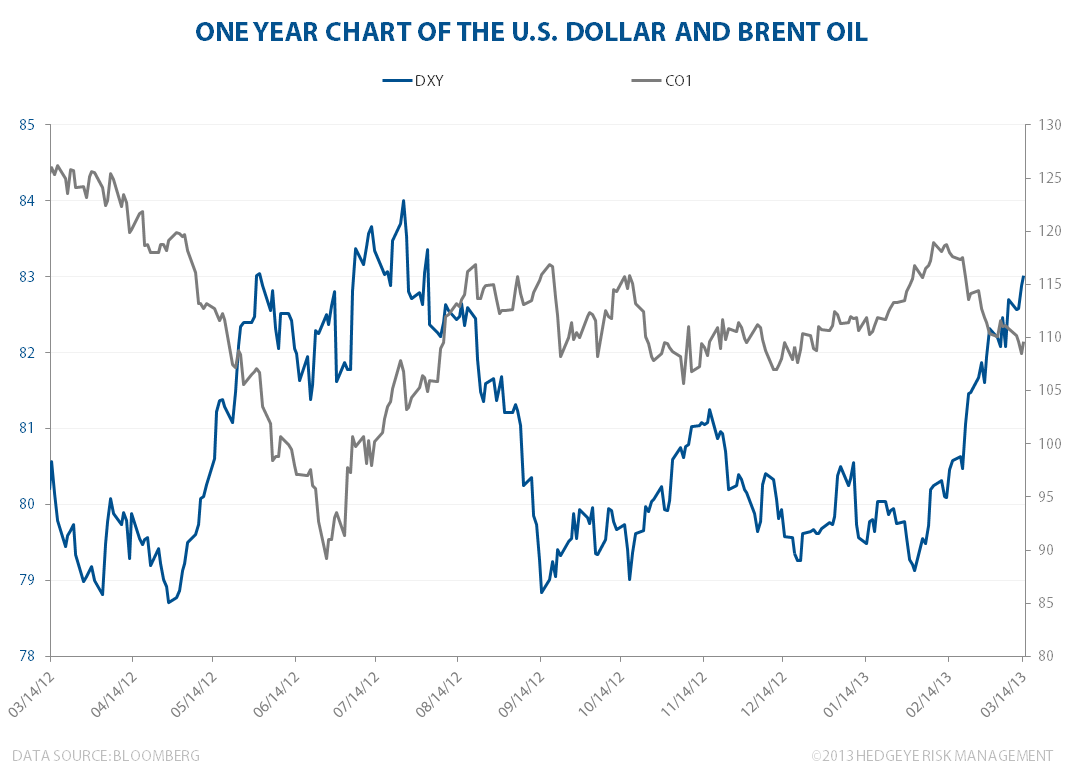
In our second chart, we show the relationship between the US dollar and Brent oil. That relationship is negatively correlated, meaning that as the US dollar moves higher, the price of Brent moves lower. Lower oil prices drive consumption growth, which effectively acts as a tax break for consumers. In other words, a strong dollar equals a strong America.