The domestic macro data continues to come in strong. Yesterday’s Retail Sales numbers beat despite the positive January revision, Housing prices continue to accelerate alongside rising demand and falling inventory, and the February Private Employment data (ADP & BLS) was decidedly positive. This morning’s initial claims data continued to confirm the positive acceleration in labor market trends as both the seasonally adjusted and non-seasonally adjusted series improved w/w.
Meanwhile, the Strong Dollar = Strong Consumption dynamic continues to play out. Strengthening SPX-$USD correlations (15D=+0.83), continued commodity deflation (15D Brent Correlation to $USD =-0.88, 30D = -0.87 ) alongside ongoing improvement in housing and employment trends still has us bullish on consumption oriented domestic equities, and bearish on treasuries, commodities/commodity exposure, and gold, on balance.
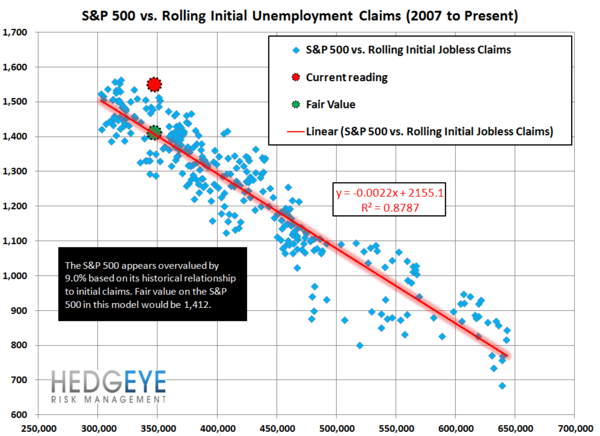
The quantitative setup for equities remains positive with our risk management model signaling a higher high for the SPX. On an immediate term basis, the next level of TRADE resistance sits at 1568.
Also, as a partial aside and update reminder as it relates to the consumer - there was a delay in the IRS processing of income tax refunds this year. As of the end of February, Individual Income tax refunds were down ~$25B vs. last year which likely exaggerated any payroll tax hike related demand weakness observed in Jan/Feb.
The latest treasury data (3/12) shows we are currently running ~$19B below last year’s pace, so the issue is beginning to resolve. On the margin, this dynamic should serve as a benefit to demand into 2Q as refunds accelerate & play catch-up.
Below is the weekly detailed analysis of the claims data from our head of Financials, Josh Steiner. If you would like to setup a call with Josh or trial his research, please contact
Labor Market Strength Accelerates
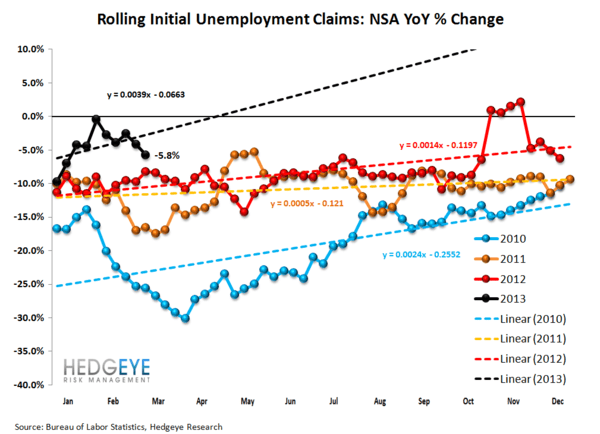
This past week's NSA (non-seasonally adjusted) initial jobless claims were lower YoY by -7.3%, which is roughly consistent with the rate of improvement over the previous two weeks (-8.9% and -8.0%). This brought the 4-week rolling average YoY change in NSA claims to -5.8% as compared with -4.2% in the previous week. What this signals is that the real labor market is experiencing accelerating improvement, and this has been the case for the last five weeks.
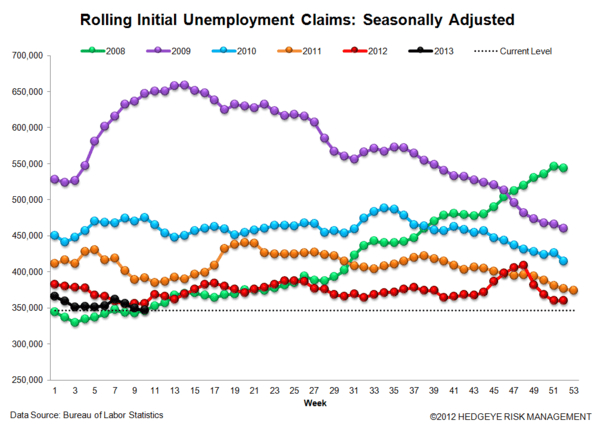
On the SA (seasonally-adjusted) front, the numbers also looked good. This is what the market is paying attention to. As a reminder, the SA data is now facing a small, but growing headwind over the coming six months. The first chart in the note tells the story well.
The Data
Prior to revision, initial jobless claims fell 8k to 332k from 340k WoW, as the prior week's number was revised up by 2k to 342k.
The headline (unrevised) number shows claims were lower by 10k WoW. Meanwhile, the 4-week rolling average of seasonally-adjusted claims fell -2.5k WoW to 346.75k.
The 4-week rolling average of NSA claims, which we consider a more accurate representation of the underlying labor market trend, was -5.8% lower YoY, which is a sequential improvement versus the previous week's YoY change of -4.2%


Joshua Steiner, CFA
Christian B. Drake
