Summary Takeaways:
- Unemployment Rate: Bullish combination of variable dynamics for unemployment rate improvement as a big delta between the change in employed (+170K M/M) and the change in the unemployed (-300K M/M) drove the Unemployment and the Labor Force Participation rate lower.
- Temp & Part-time Workers: Growth in Temp & Part-time employment continues to decline. To the extent FT can displace temp/part-time workers, consumption stands to benefit as workers gain benefits, weekly wages rise, and confidence/clarity around future income supports marginal spending decisions.
- Employment by Age: The barbell recovery in employment remains in effect as employment growth for 20-35 and 55+ year olds remains healthy while job growth for 35-54 year olds is back to negative.
- State & Local Employment: Continues to tread water just below the zero line. It's still unclear how much of an impact the sequester will have on hiring decisions at the state & local gov’t level
- Revision: January’s Private payroll number was revised lower by 26K. The market should look through the negative revision given the strength in the February number. Adjusted for the negative revision, the change in private payrolls for February still beat by 50K.
Today’s Employment data supports our constructive view on domestic #growthstabilizing, and offers positive confirmation of the accelerating labor market trends observed in both the initial claims and ADP series.
Below we revisit the idea of seeing a 6-handle in unemployment in 2013, and provide a two-pronged breakdown of today’s Labor Market Numbers: Analysis of the Current Population Survey (Household Survey) which drives the Unemployment Rate & the Establishment Survey (CES) which drives the NFP Number:
6-Handle? In a previous scenario analysis, we examined the extent to which the variables driving the unemployment rate would have to move to push unemployment below 7% over 2013 (Will We See 6.5% Unemployment in 2013? ). While a sub-7% unemployment rate probably wouldn’t represent our baseline case, we wouldn’t view it as a tail probability either. In fact, the declining labor force participation rate and 200K+ employment gain we saw this month represents the variable dynamic required for a move below 7% over the NTM.
A continuation of February's trend and a run at a 6-handle in unemployment into 2013 year-end would effectively extend our existing investment view – long consumption oriented equities, short bonds and commodities as the growth/employment data would remain equity bullish, $USD Bullish (via shifting policy and interest rate expectations) and bond & commodity (to the extent negative correlations to the $USD hold) bearish.
Household Survey:
Total Employed & Employment By Age: Total Employment as measured by the household survey was up 170K in February with y/y growth decelerating 2bps sequentially to 1.0%.
The hallmark of the employment downturn thru the Great Recession was the contrast between the extreme job loss among younger cohorts and the relative employment stability among older workers (employment for 55-64 yr. olds never went negative through the great recession). What we’ve seen over the last three years has been a distinct barbell recovery as employment growth for 20-35 and 55+ year olds has been strong while job growth for 35-54 year olds has failed to gain sustainable traction. This trend extended itself further in February.
As it relates to our bullish view on housing, the 20-35 year old cohort remains the biggest demographic driver of household formation. Continued positive employment growth in that age group should provide an ongoing support to housing demand.

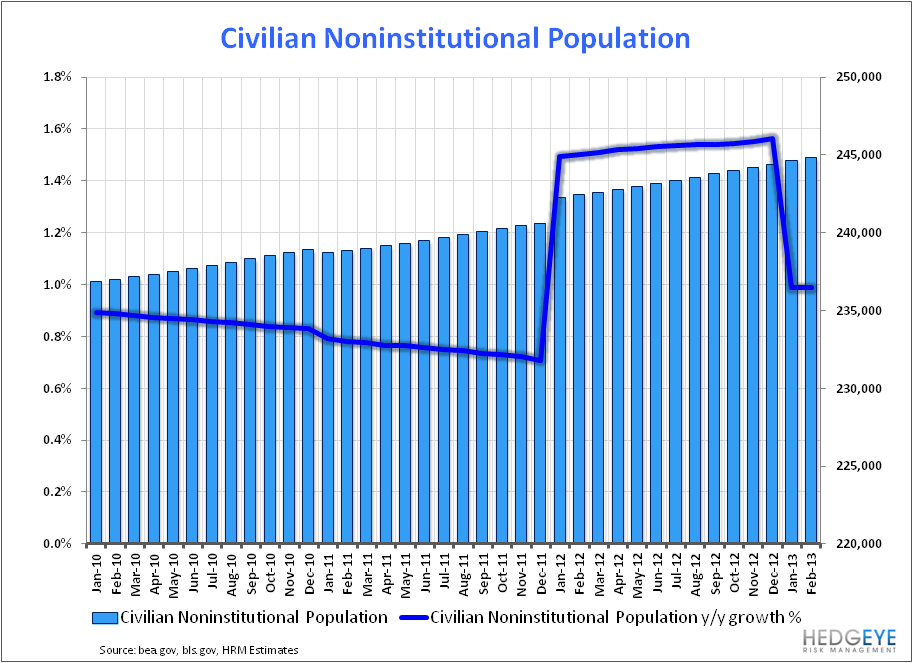
Civilian Noninstitutional Population: Each January the Census Bureau's estimates of the civilian noninstitutional population ages 16 and over are revised back to the base period for intercensal estimation, currently April 2010. The annual benchmark adjustment is applied without any smoothing or rearward revision and shows up as single bolus in the January release.
The January 2013 adjustment (+138K) was largely benign from a historical perspective. Following the January Adjustment, growth estimates for the CNP are generally stable for the balance of the year. Note that is the difference between growth in the CNP and growth in the Total Labor Force (Employed + Unemployed as measured by the BLS Household Survey) that drives the movement in the Labor Force Participation Rate.
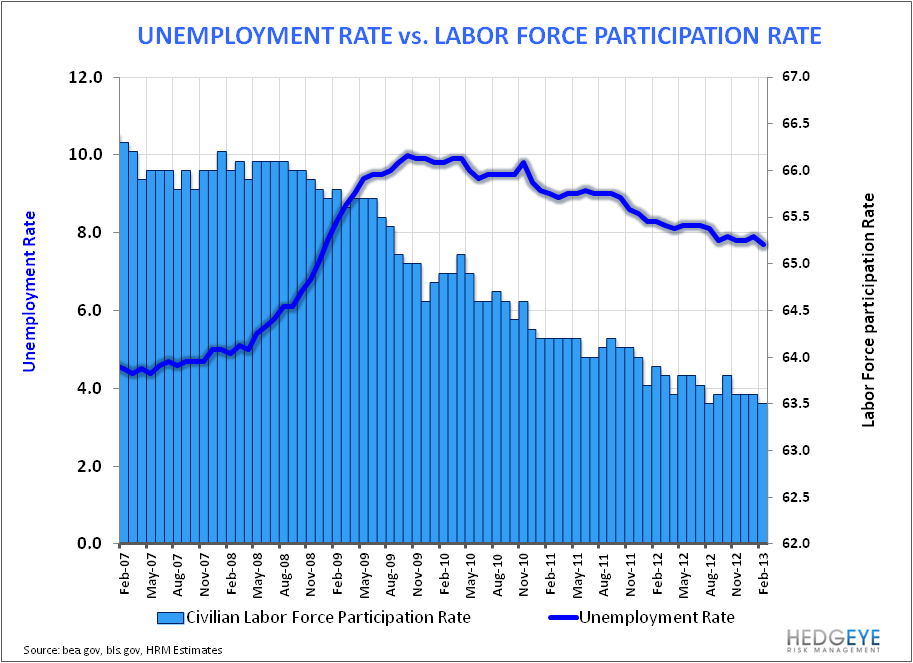
Unemployment Rate: The Unemployment rate decreased from to 7.9% to 7.7% m/m. As an Unemployment 101 reminder, the Unemployment & Labor Force Participation rates are primarily a function of 3 variables: The growth in the Civilian Noninstitutional Population (CNP), growth in the Employed, and growth in the Unemployed.
The sum of Employed + Unemployed = The Total Labor Force, The Unemployed as a % of the Total Labor Force (i.e. Employed + Unemployed) = Unemployment Rate, and the Total Labor Force/CNP = Labor Force Participation Rate.
In terms of the variable dynamics, there are a couple of simple relationships to keep in mind. First, as it relates to the Labor Force Participation Rate, if growth in the Total Labor Force (Employed + Unemployed) is faster than growth in the Civilian Noninstitutional Population, then the labor force participation rate will increase & vice versa. Second, as it relates to the Unemployment Rate, if growth in the Employed is stronger than growth in the Unemployed or, conversely, if the decline in the unemployed in greater than the decline in the employed, the Unemployment rate stands to benefit. .
Thus, a rising participation rate alongside a declining unemployment rate represents the most bullish factor combination and a declining participation rate alongside a rising unemployment rate the most bearish combination from an economic/end consumption perspective. A declining participation rate alongside a declining unemployment rate, which is the dynamic we have observed for the better part of the last few years, reflects a mixed labor market picture as the decline in the unemployed has been more a function of individuals dropping out the Labor Force (discouraged, retiring, disabled) than it was those individuals gaining employment.
The principal driver of the decrease in Unemployment this month was the delta between the change in the employed and the change in the unemployed. Total Employed increased 170K sequentially while the Total Unemployed declined 300K sequentially, a 407K delta. In this instance, the -300K change in the numerator (Unemployed/(Employed + Unemployed) dominates the impact and serves to drive the Unemployment Rate lower.
Part-time & Temp Employment: Part-time employment (household survey) increased 102K m/m but growth remains negative on a y/y basis. Temp employment growth (establishment survey) followed a similar trajectory, increasing 16K m/m while decelerating 140bps sequentially on a y/y basis.
To the extent growth in full-time employment can displace growth in part/temp employment and business can gain some further fiscal policy clarity into mid-year (post sequester, debt ceiling, budget resolution) sustainable real consumption growth stands to benefit as workers gain health/retirement benefits, weekly wages rise, and confidence/clarity around future income supports marginal spending decisions.


Establishment Survey:
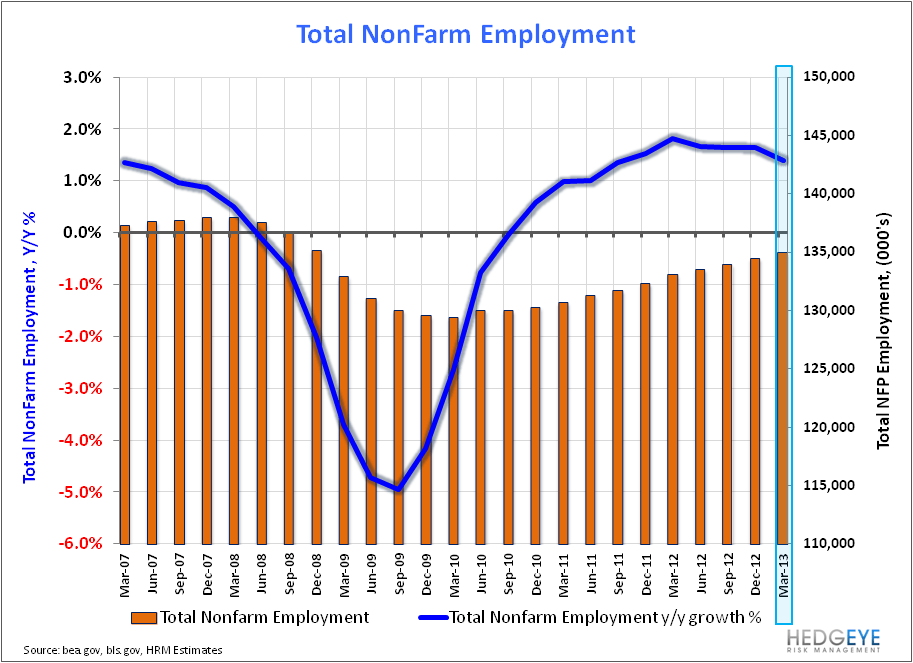
Total NFP Gains & Growth: Total Nonfarm Payrolls increased 236K in January vs. consensus at 165K while Private Payrolls rose 246K on estimates of 166K. January’s Private payroll estimate was revised lower by 26K. We’d expect the market to look through the negative revision given the strength in the February number. Adjusted for the negative revision, the change in private payrolls for February still beat by 50K. Employment comps get marginally easier as we move through the year.
State & Local Government employment: After a four year run of negative growth, state & local employment growth continues to stagnate just below the zero line. Collectively, states expect continued tax revenue growth in 2013 with total General fund revenues expected to surpass the 2008 peak in nominal terms. The continued recovery in revenues should be a tailwind for employment and investment, however, sequestration and uncertainty around impending fiscal policy decisions at the federal may be weighing on hiring decisions at the state/local gov’t level currently.

Christian B. Drake
Senior Analyst
