Yesterday’s fire and brimstone gave way to more of what we’ve been expecting on the bullish side of housing and the consumer. Today’s major econ releases showed housing continues to accelerate while the consumer is largely shrugging off the payroll tax increase, rising gas prices, and continued fiscal policy uncertainty. As we move past mid-quarter, we remain constructive on our 1Q13 Macro Investment themes of #HousingsHammer and #Growthstabilizing.
Below we provide summary takeaways for today’s New Homes Sales & FHFA Data, Consumer Confidence, and the Richmond Fed Manufacturing survey.
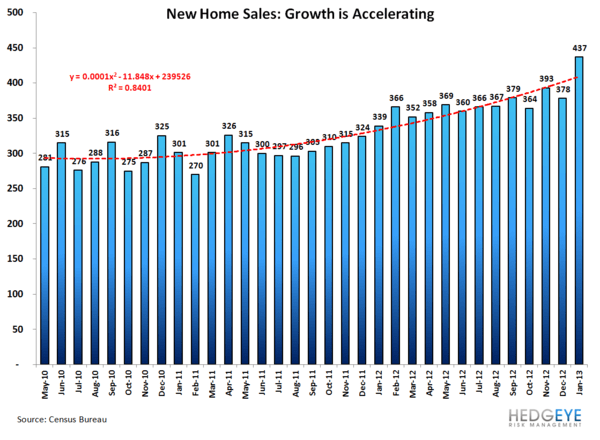
#HousingsHammer: Today’s data continues to confirm our bullish housing thesis as the New Home Sales and FHFA HPI both came in extremely strong.
- New Home Sales: New Home Sales rose 15.6% MoM and +28.9% Y/Y, marking the fasting rate of growth in 12 months. Inventory was flat sequentially at 150K, while monthly supply dropped to 4.1 months, the lowest level since 2005. The combination of Accelerating Demand (sales) and Declining Supply (months inventory) remain supportive of our expectation for meaningful home price appreciation in 2013.
- FHFA Home Prices: The FHFA home price data for December showed home prices increased 0.6% M/M, accelerating to +5.81% Y/Y, marking the highest level since November 2009.
- To the extent pricing and construction activity can accelerate from here, the confluence of housing wealth and fixed investment growth stand to serve as a discrete offset to impending fiscal policy decisions.
Chart Source: Hedgeye Financials


Consumer Confidence: Consumers apparently shrugged off both the payroll tax increase and rising gas prices as the Conference Board Consumer Confidence reading surprised to the upside, printing 69.6 vs expectations for 62.0 and 58.4 prior. The sub-indices told a cohesive story with present conditions and expectations readings gaining sequentially while measures of current and expected employment conditions both improved. Today’s reading agrees with beat out of the prelim Univ of Michigan sentiment index which came in at 76.3 vs expectations of 74.8 and 73.8 prior.
While Economic and Market Price Correlations to Consumer Confidence have broken down significantly in the years since 2009, historically, measures of consumer confidence have served as strong leading indicators for economic activity. For example, on a 10Y basis, lagged correlations to New Manufacturing Orders, PCE Services, and M2 velocity (the hereto unrealized goal of Fed Policy) are all > 0.85.
With confidence readings beginning to show some upside to close the year, labor market trends remaining healthy, reflation in distressed housing inventory supporting bank capital positions and credit standards showing incremental loosening, we’ll be watching for any re-tightening in the relevant confidence-econ activity correlations a little more closely.


The FED SPREAD: The Richmond Fed printed +6 on expectations of -4 and -12 prior. Under the hood, the Shipments, New Orders and Employment components of the Current Conditions Index all improved sequentially, while Prices Paid decelerated 50bps M/M.
On balance, the regional fed manufacturing indices have been surprising to the upside in February with the Dallas Fed reading holding positive and Empire State Mfg printing +10 after 6 consecutive months of negative readings and vs. expectations of -2. The Phili Fed index was the negative outlier printing -12.5 on expectations for +1 in February.
Across the active history of the collective Regional Indices, the breadth of strength/weakness has served as a decent indicator for growth, particularly when the spread moves towards the extremes. The read through to growth is largely equivocal thus far in 1Q13 with the spread sitting at -1.


Christian B. Drake
Senior Analyst
