Key Takeaways:
* In spite of the sentiment asymmetry (Financials sentiment remains an 8-9 on a 10 scale based on current levels of short interest), pressing the risk side of the trade continues to work for now. While we remain cautious that the data will show signs of turning in the intermediate term, the short-term shows no red flags as yet. For now, higher-beta Financials should continue to outperform.
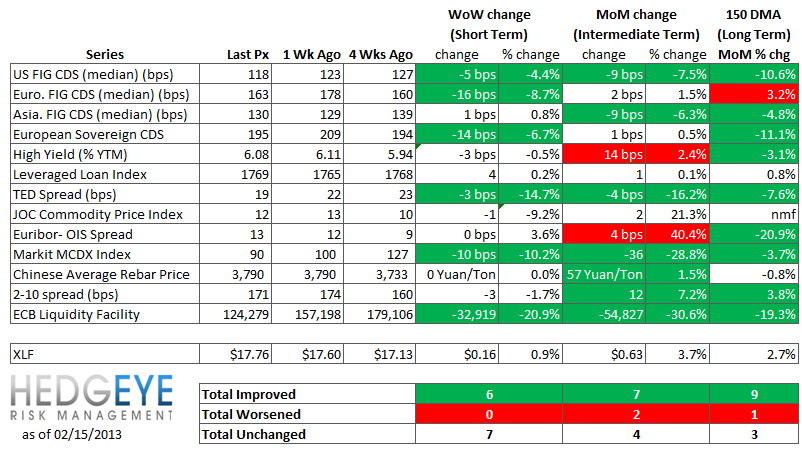
* TED Spread – The TED spread fell 3.3 basis points last week, ending the week at 19.11 bps this week versus last week’s print of 22.4 bps. For reference, this is the lowest level for the TED Spread since a brief stint in late July 2011 in the 16-19 bps range.
* Markit MCDX Index Monitor – Spreads on 2016 muni bonds tightened by a further 10 bps, ending the week at 90.25 bps versus 100.49 bps the prior week. This index has been rapidly declining since year-end, and has been generally trending lower since its late 2011 highs (230 bps) following a call for the conditions of the municipal finance sector to deteriorate significantly.
* 2-10 Spread – While spreads tightened 3 bps in the latest week to 171 bps, the trend here has been generally higher over the last two months. Spreads are up 30-40 bps since mid-December last year.
Financial Risk Monitor Summary
• Short-term(WoW): Positive / 6 of 12 improved / 0 out of 12 worsened / 7 of 12 unchanged
• Intermediate-term(WoW): Positive / 7 of 12 improved / 2 out of 12 worsened / 4 of 12 unchanged
• Long-term(WoW): Positive / 9 of 12 improved / 1 out of 12 worsened / 3 of 12 unchanged
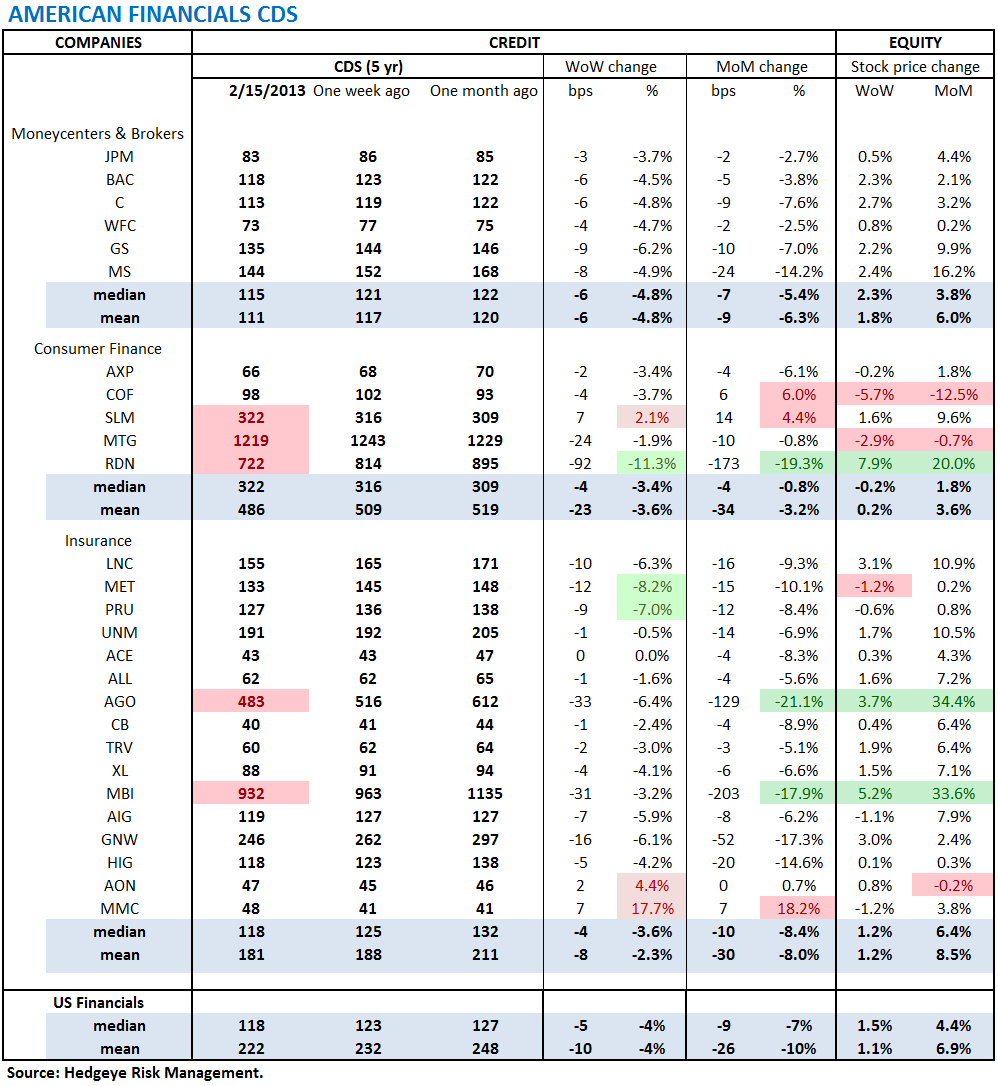
1. American Financial CDS - All U.S. financials tightened except for Sallie Mae (+8 bps), Aon (+2 bps) and Marsh & McLennan (+7 bps). Large-cap U.S. Financials continue to post steadily decreasing risk profiles. Swaps tightened for 24 out of 27 domestic financial institutions.
Tightened the most WoW: RDN, MET, PRU
Widened the most WoW: MMC, AON, SLM
Tightened the most WoW: AGO, RDN, MBI
Widened the most MoM: MMC, COF, SLM
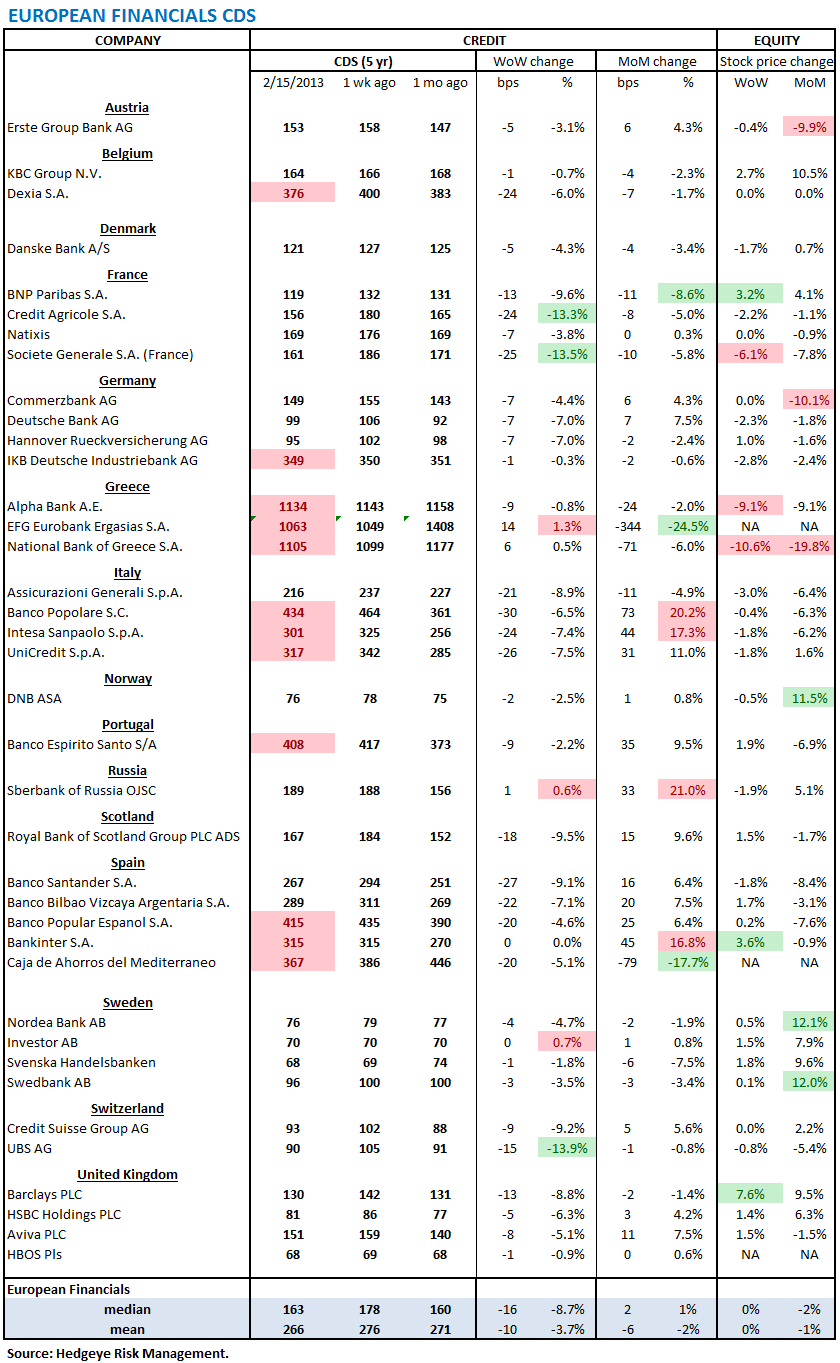
2. European Financial CDS - EU financials CDS was near universally tighter last week, with the exception of Greek banks. The largest improvements were at French, Spanish and Italian banks. British and German banks were also improved.
3. Asian Financial CDS - Swaps of major Aisan Financial companies were lower across the board with the exception of Daiwa, which was wider by 8 bps. Chinese banks posted the largest improvement.

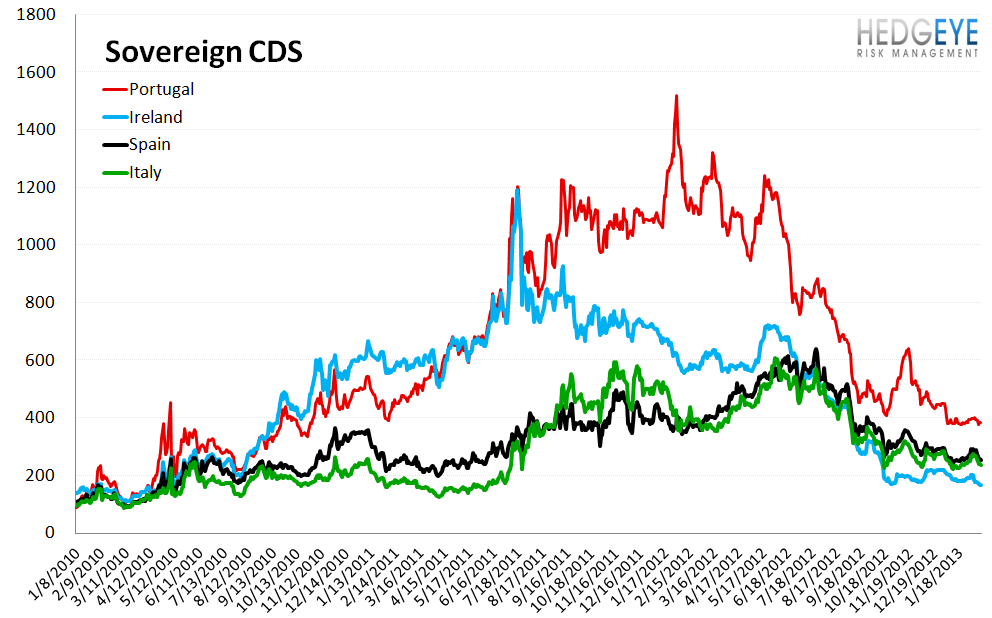
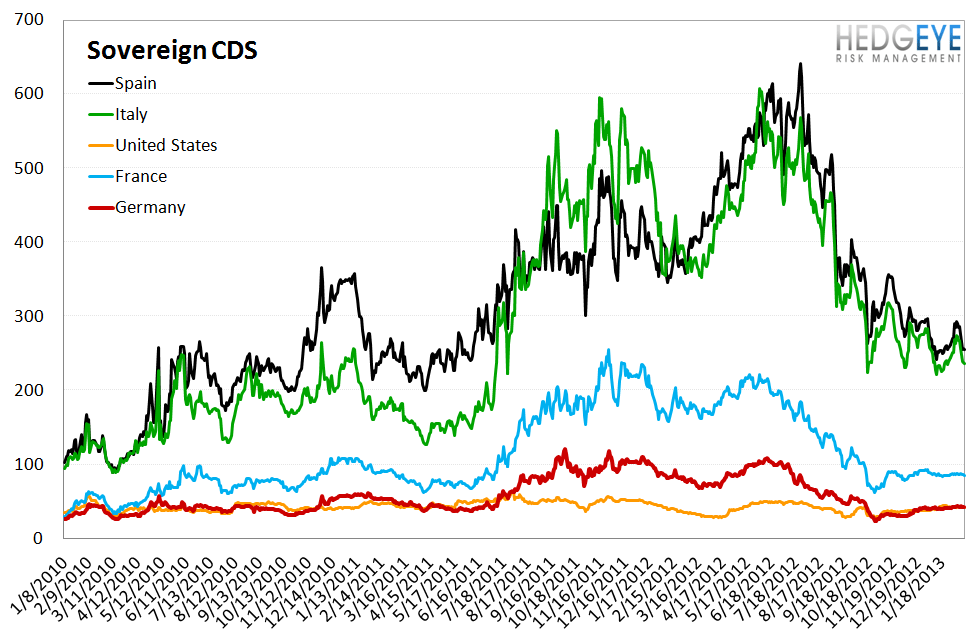
4. Sovereign CDS – Italy, Spain and Portugal posted sharp improvements with swaps tightening 30, 29 and 13 bps, respectively. Ireland was close behind with 12 bps of tightening. Portugal remains the most risky major EU country (ex-Greece) at 382 bps. Spain is next at 255 bps. The recent run-ups in these countries have faded and they are again trading near their multi-year lows.

5. High Yield (YTM) Monitor – High Yield rates fell 3.2 bps last week, ending the week at 6.08% versus 6.11% the prior week.

6. Leveraged Loan Index Monitor – The Leveraged Loan Index rose 3.6 points last week, ending at 1769.

7. TED Spread Monitor – The TED spread fell 3.3 basis points last week, ending the week at 19.11 this week versus last week’s print of 22.4. For reference, this is the lowest level for the TED Spread since a brief stint in late July 2011 in the 16-19 bps range.

8. Journal of Commerce Commodity Price Index – The JOC index fell -1.2 points, ending the week at 11.54 versus 12.7 the prior week.

9. Euribor-OIS Spread – The Euribor-OIS spread was unchanged at 13 bps. The Euribor-OIS spread (the difference between the euro interbank lending rate and overnight indexed swaps) measures bank counterparty risk in the Eurozone. The OIS is analogous to the effective Fed Funds rate in the United States. Banks lending at the OIS do not swap principal, so counterparty risk in the OIS is minimal. By contrast, the Euribor rate is the rate offered for unsecured interbank lending. Thus, the spread between the two isolates counterparty risk.

10. ECB Liquidity Recourse to the Deposit Facility – Deposits with the ECB Liquidity Facility continue to drop. Deposits are currently 124 billion Euros, down from 400 billion Euros in mid-2012, and down from over 800 billion throughout the first half of 2012. The ECB Liquidity Recourse to the Deposit Facility measures banks’ overnight deposits with the ECB. Taken in conjunction with excess reserves, the ECB deposit facility measures excess liquidity in the Euro banking system. An increase in this metric shows that banks are borrowing from the ECB. In other words, the deposit facility measures one element of the ECB response to the crisis.

11. Markit MCDX Index Monitor – Last week spreads on 2016 muni bonds tightened by a further 10 bps, ending the week at 90.25 bps versus 100.49 bps the prior week. This index has been in total freefall since year-end, and is generally trending lower since its late 2011 highs (230 bps) following a call for the muni market to deteriorate. The Markit MCDX is a measure of municipal credit default swaps. We believe this index is a useful indicator of pressure in state and local governments. Markit publishes index values daily on six 5-year tenor baskets including 50 reference entities each. Each basket includes a diversified pool of revenue and GO bonds from a broad array of states. We track the 16-V1.

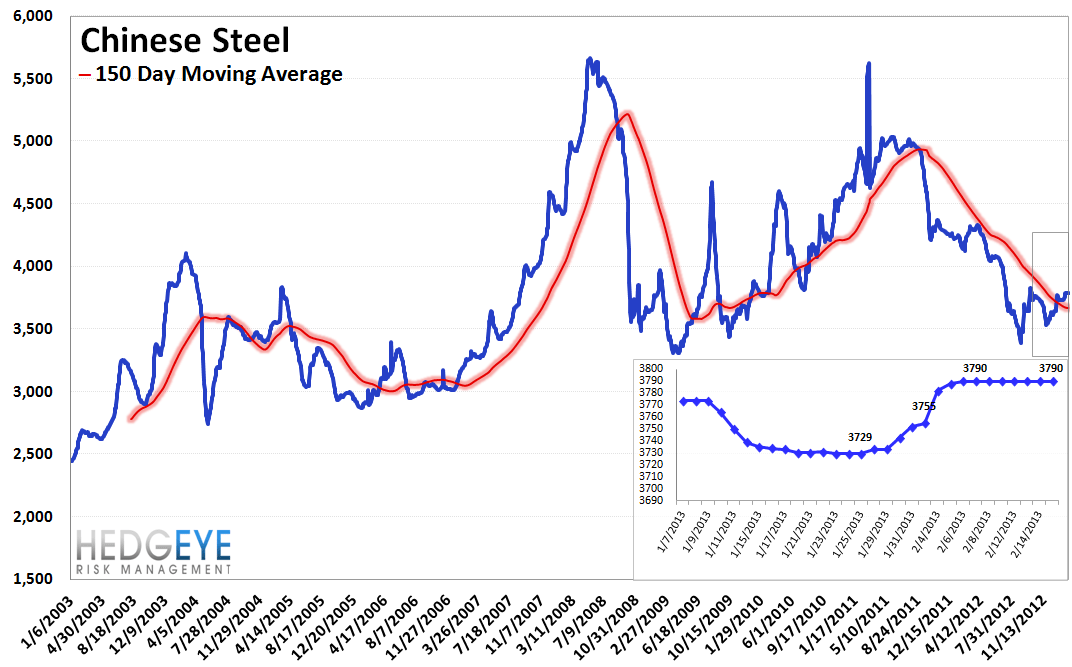
12. Chinese Steel – Steel prices in China were flat last week at 3,790 yuan/ton. While there is some concern this morning about Chinese property values, the price of Chinese steel has been moving generally higher since late November of 2012. We use Chinese steel rebar prices to gauge Chinese construction activity, and, by extension, the health of the Chinese economy.
13. 2-10 Spread – Last week the 2-10 spread tightened to 171 bps, -3 bps tighter than a week ago. Bigger picture, however, the 2-10 yield spread has been tracking generally wider since mid-December of last year, when it was in the mid-130 bps range. We track the 2-10 spread as an indicator of bank margin pressure.

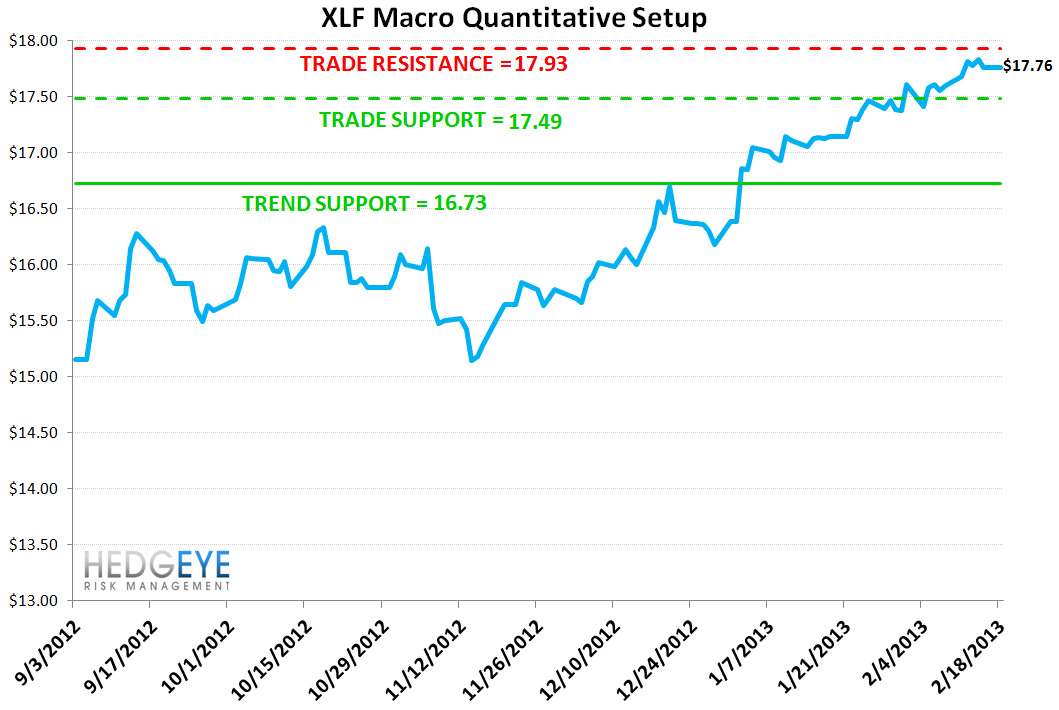
14. XLF Macro Quantitative Setup – Our Macro team’s quantitative setup in the XLF shows 1.0% upside to TRADE resistance and 1.5% downside to TRADE support.
Joshua Steiner, CFA
