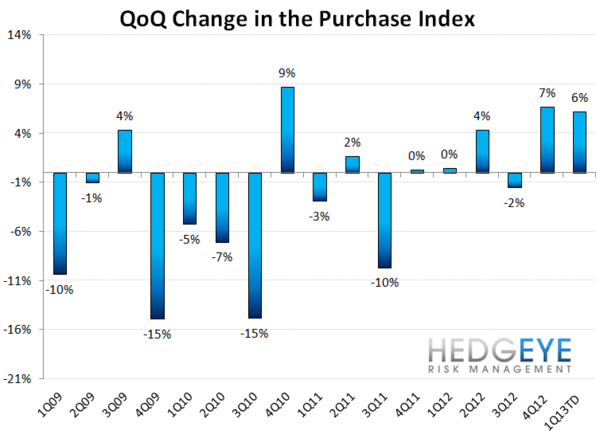
Expectations for continued improvement in the domestic housing market - a theme we've dubbed #HousingsHammer - remains a 1Q13 Macro Investment theme we continue to like. Superficially, this morning’s -10% print in the MBA Purchase Index would appear to signal a change in trend and a notable drop off in demand.
However, an analysis of the historical seasonal pattern for February in conjunction with the trajectory of the broader, rolling 4wk and 1Q13 YTD growth trend suggest this week’s steep decline represents a poor reflection of underlying demand.
Below is a more detailed analysis of this morning’s MBA Mortgage Application release from our Head of Financials (and all things Housing Related) Josh Steiner. Email if you would like to trial Josh’s work.
Don't Be Fooled By This Morning's Weak Print
This morning's print from the MBA certainly got our attention, as the purchase index was reportedly down 10.0% week-over-week, reversing a string of positive progress since the start of the year. Did demand to buy houses really drop 10%? We don't think so.
There are a couple ways to approach this, but the simplest are to consider whether there was an inflection in the year-over-year rate of change, and there was virtually none. This past week was up 20.5% vs. the prior year, which compares with the YoY growth over the preceding three weeks of: 22.6%, 20.3% and 20.7%. In other words, the weakness seems to be stemming from a recurrent seasonal adjustment distortion and not from a bona fide decline in demand. This is backed up by looking at WoW change for this past week in prior years. In 2012, this week was down by -8.4%, which was then recovered shortly thereafter. In 2011, this week was down by -5.9%, which was recovered in the following week. In 2010, it was down -7.0%, which was again shortly thereafter recovered. As such, we would certainly expect to see purchase demand bounce back in the weeks ahead.
Taking a bigger picture view, as we mentioned above, the last four weeks of purchase data have been growing at an average rate of +21.0% YoY. On a 1Q13TD basis, the volume is up 16.5% vs. 1Q12, and continues the streak of 5 consecutive quarters of sequential YoY growth acceleration. There is little doubt, at least to us, that mortgage purchase demand remains strong and continues to accelerate.
Our bullish thesis on housing continues to revolve around price and the idea that housing is a Giffen good. As prices rise, consumers buy more of housing and vice versa. The empirical evidence bears this out. This is also at the heart of why housing trends tend to be autocorrelated. Rising prices beget growing demand, which, in turn, reinforce further price increases and so on. So long as we see demand rising, which it is, our bullish thesis on housing remains intact.
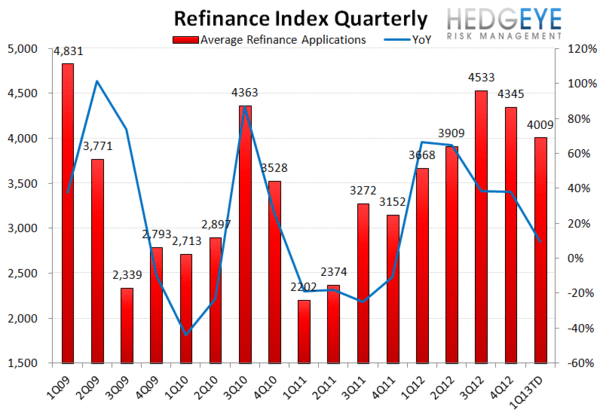
Refi Continues to Cool
Refinancing activity, not surprisingly, continues to cool down vs. its recent 3Q12 peak as rates continue to creep higher. Refi volume was down 6.0% week-over-week, which brings the index level to 3,887. This compares with the 1Q13TD average of 4,009 and the 4Q12 average of 4,345 (3Q12 was 4,533). 1Q13TD is still 9% higher than 1Q12 levels of activity, but on a QoQ basis, it's down 8%.
Rates on 30-year fixed conforming loans have backed up from lows in the 3.4% range throughout 4Q12 to 3.64% today based on the Bankrate index. Using the contract interest rate provided by the MBA, rates have risen to 3.75%, up 2 bps WoW and up in 8 of the last 9 weeks.
The outlook for refi activity is clouded by two big unknowns. First, rates appear to be headed slowly but steadily higher. This is putting obvious pressure on activity levels. Second, President Obama would like to roll out underwater refinancing availability to non-GSE borrowers (HARP 3.0), though this remains more of a proposal than a probable event at this point.
Taken together, the purchase and refi activity, overall mortgage activity is tracking +8.3% YoY thus far in the first quarter and down -5% vs. 4Q12.
Joshua Steiner, CFA