I Know I've Seen This Before ...
Initial jobless claims posted their largest 1-week decline since this same week last year. Claims fell 37k to 335k. For reference, in the corresponding week in 2012, claims fell 46k (to 356k) only to then bounce higher by 23k in the following week. That said, in the five weeks that followed that 23k bounce, claims trended lower by a further 25k. This is precisely the Jan/Feb tailwind we've been describing, and why we would expect a bonce in claims next week, but a strong tailwind to re-emerge through February-end.
Beginning in March and running through August, initial jobless claims will shift from having the wind at their back to the wind at their front. The effect will be subtle at first, but it will build compounding momentum. We'd expect the next six weeks of strong tailwinds (next week notwithstanding) to fuel the rally in Financials.
The Numbers
Prior to revision, initial jobless claims fell 36k to 335k from 371k WoW, as the prior week's number was revised up by 1k to 372k.
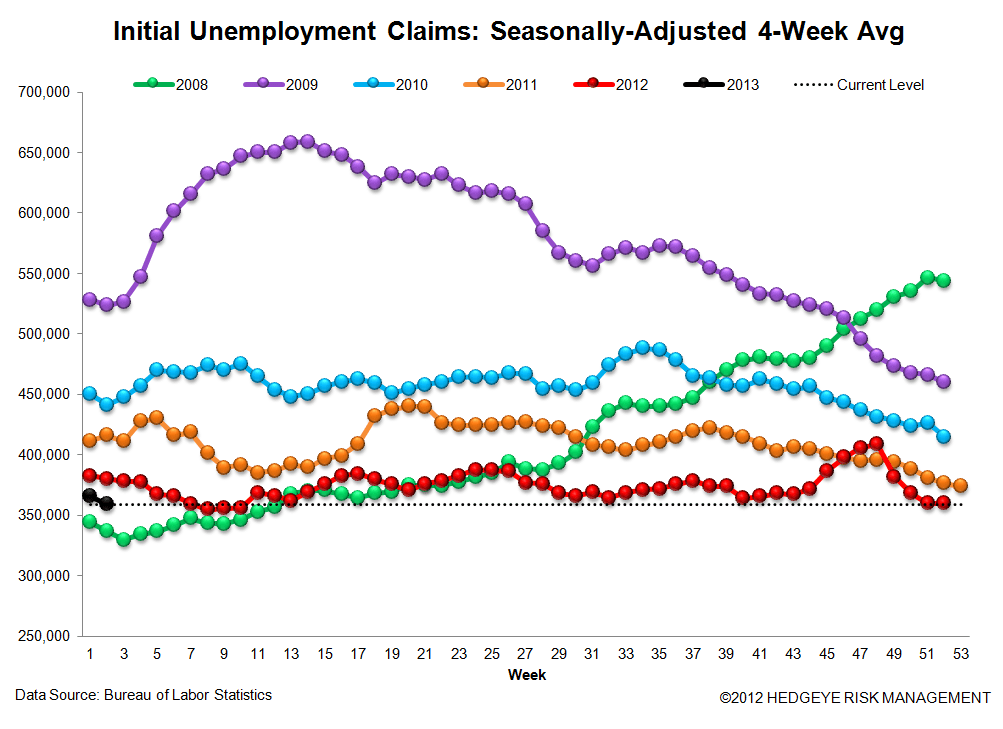
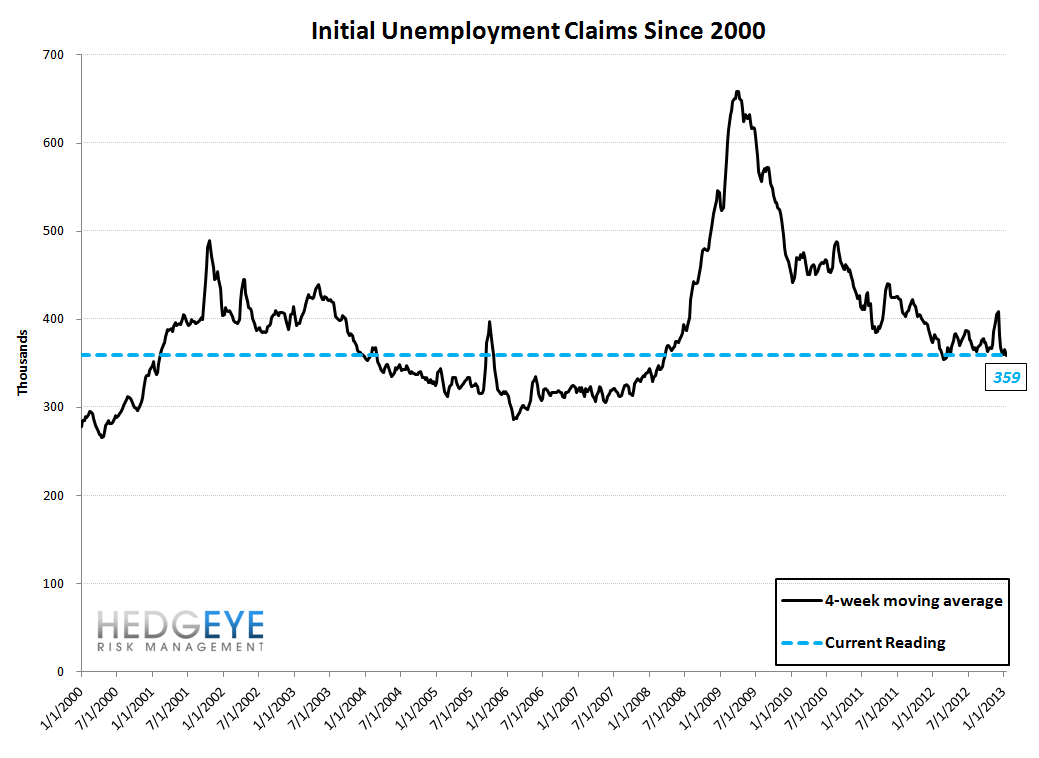
The headline (unrevised) number shows claims were lower by 37k WoW. Meanwhile, the 4-week rolling average of seasonally-adjusted claims fell -6.75k WoW to 359k.
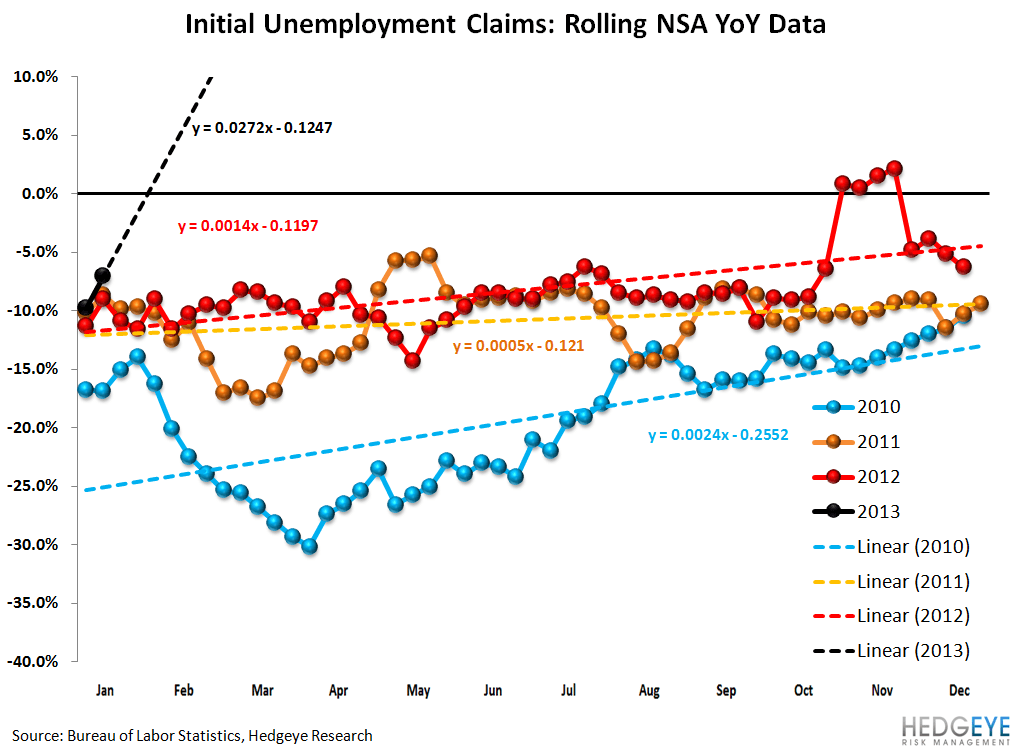
The 4-week rolling average of NSA claims, which we consider a more accurate representation of the underlying labor market trend, was -7.0% lower YoY, which is a sequential deterioration versus the previous week's YoY change of -9.7%


Joshua Steiner, CFA
