Here is some more detail on the final December numbers from Macau:
Y-O-Y TABLE OBSERVATIONS
Total table revenues grew 21% in December. Mass revenue growth was strong at 32%, just a little above the 6-month trailing average of 31%. VIP revenues grew 16% - the best growth in 9 months. Junket RC volume grew 9% YoY. We expect that January’s growth rate will slow to 7-12% growth, due to the smoking restrictions and unfavorable calendary.
LVS
Table revenues grew 52% YoY (Mass +48%; VIP+55%), garnering the best growth in the market for the 6th straight month. We estimate that Sands China held at 3.14% vs 2.86% last year, adjusted for direct play of 19%.
- Sands table revenue fell 9% YoY, aided by high hold but hurt by an even tough comparison.
- Mass grew 12%
- VIP was down 20%. We estimate that Sands held at 3.70% in December compared to 4.01% in the same period last year. We assume 9% direct play in December vs 11% in December 2011.
- Junket RC declined 11% YoY, aside from September; 12 of the 13 trailing months have seen YoY declines in RC volume.
- Venetian table grew 19% YoY, negatively impacted by low hold but offset by an easy comparison.
- Mass increased 15%
- VIP was grew 24%
- Junket VIP RC increased 14%, breaking 10th consecutive months of declines at Venetian
- Assuming 30% direct play, hold was 2.70% compared to 2.59% in December 2011, assuming 27% direct play (in-line with 4Q11)
- Four Seasons continued to perform well, growing 43% YoY, driven by high hold and an easy comparison
- Mass revenues were flat YoY
- VIP grew 52% and Junket VIP RC rose 16% YoY
- If we assume direct play of 16%, in-line with the first 3Q of 2012, hold in December was 3.19% vs. 2.42% in December 2011 when direct play was ~16%
- Sands Cotai Central produced $169MM in December
- Mass revenue of $62MM, $1MM lower MoM
- VIP revenue of $107MM
- Junket RC volume of $2.83 BN, up 2% MoM
- If we assume that direct play was 9%, hold would have been 3.46%
WYNN
Wynn table revenues fell 10% YoY in December. Hold was high but last year’s comparison was more difficult.
- Mass was up 4% YoY– the worst performance of the 6 concessionaires for the 4th consecutive month
- Wynn was the only concessionaire to record a decline in VIP revenues this month, which fell 13%. With the exception of September, Wynn has had YoY declines in VIP revenues for the last 8 of 9 months.
- Junket RC fell 9%, the worst performance of the group. Aside from a 1% gain in November, 7 of the last 8 consecutive months have been in the red.
- Assuming 10% of total VIP play was direct (in-line with 3Q12), we estimate that hold was 3.10% compared to 3.21% last year (assuming 11% direct play – in-line with 4Q11).
MPEL
MPEL table revenue grew 14%, negatively impacted by low hold and a difficult YoY comparison. Hold across MPEL’s two properties was 2.84% vs. 3.16% last year.
- Altira revenues grew 11%, with a 21% increase in Mass and a 10% increase in VIP
- VIP RC increased 13%, breaking its 12th month consecutive streak of losses
- We estimate that hold was 3.11%, compared to 3.30% in the prior year
- CoD table revenues grew 15% YoY, despite low hold
- Mass revenue grew an impressive 62%, offset by a 2% drop in VIP revenue
- RC grew 13%
- Assuming a 15% direct play level, hold was 2.70% in December compared to 3.08% last year (assuming 16% direct play)
SJM
Table revenue grew 20%
- Mass revenue was up 9% and VIP revenue grew 25%
- Junket RC grew 12%
- Hold was 3.03%, compared with 2.70% last December
GALAXY
Galaxy table revenues grew 14%. Mass growth took the top spot with 59% growth. VIP revenues only grew 3%YoY, despite high hold. Across its two owned properties, Galaxy held at 3.39% vs. 3.04% in December 2011.
- StarWorld table revenues fell 2%, marking the 7thconsecutive month of declines
- Mass grew 57%, offset by a 9% drop in VIP
- Junket RC fell 11%, marking the 7th month of consecutive declines
- Hold was normal at 2.84% vs. an easy comparison of 2.76% last December
- Galaxy Macau's table revenues grew 33%
- Mass grew 63%
- VIP grew 25%, while RC grew 8%, breaking a 4 consecutive month streak of declines
- Hold was high in December at 3.86% vs. 3.34% last year
MGM
MGM table revenue grew 38% in December, aided by high hold.
- Mass revenue grew 51%
- VIP revenue grew 35% on a 10% increase in VIP RC.
- If direct play was 8%, then December hold was 3.55% compared to 2.90% last year
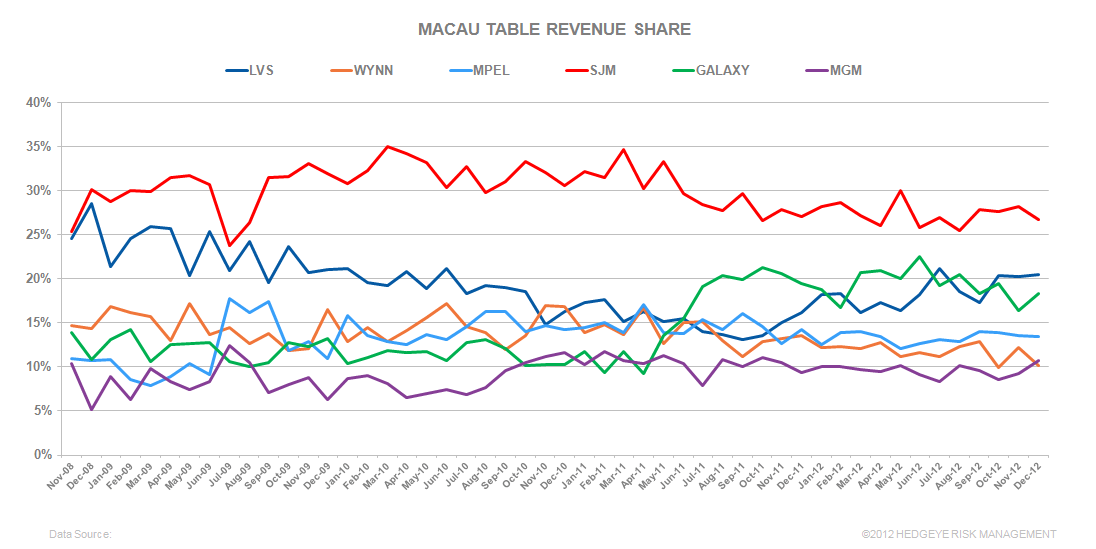
SEQUENTIAL MARKET SHARE
LVS
LVS’s MoM share increased 20bps to 21.0%. December’s share was better than its 6 month trailing market share of 20.2% and better than Sands’ 2011 average share of 15.7%.
- Sands' share was flat at 3.7%. For comparison purposes, 2011 share was 4.6% and 6M trailing average share was 3.8%.
- Mass share ticked down to 5.3%
- VIP rev share was flat at 3.0%
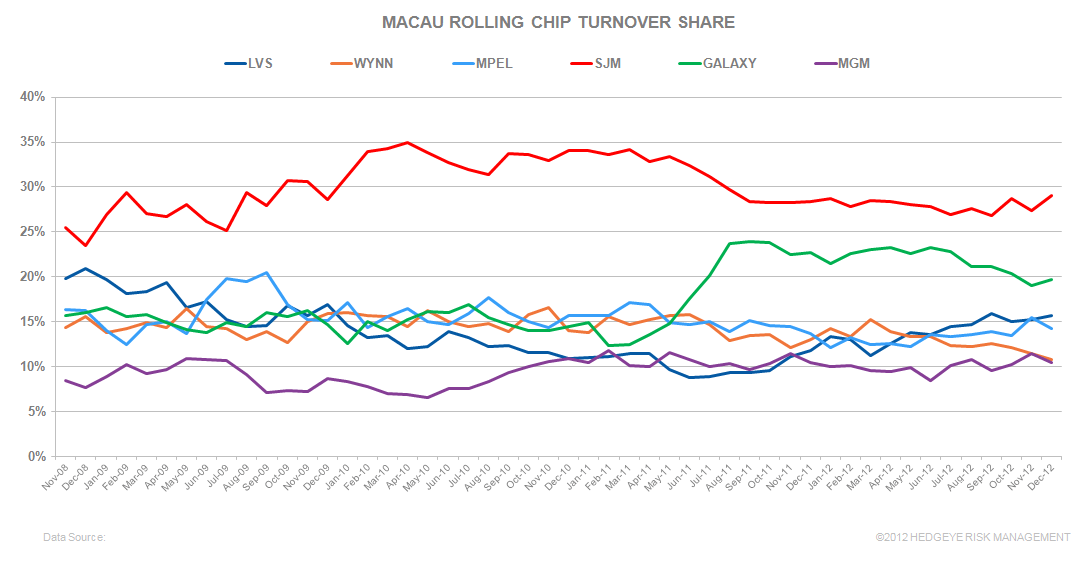
- RC share was 2.4%, down 10bps MoM
- Venetian’s share ticked up 10bps to 8.0%. 2011 share was 8.4% and 6 month trailing share was 8.1%.
- Mass share fell 40bps to 13.1%
- VIP share increased 30bps to 5.9%
- Junket RC share increased 1% to 5.1%
- FS was flat at 3.7%. This compares to 2011 share of 2.2% and 6M trailing average share of 3.2%.
- VIP ticked up 10bps to 4.6%.
- Mass share fell 30bps to 1.6%
- Junket RC fell 40bps to 4.1%
- Sands Cotai Central's table market share ticked up 10bps to 5.0% and compares to the 6M trailing average share of 4.5%.
- Mass share of 6.2%
- VIP share of 4.5%
- Junket RC share ticked down 10bps to 4.0%
WYNN
Wynn was the biggest share donor in December, losing 1.8% to 10.3% in December. Wynn’s 2011 share averaged 14.1% and their 6-month trailing share averaged 11.5%.
- Mass market share increased 50bps to 8.0%, an all-time property low
- VIP market share plunged 3.1% to 11.1%
- Junket RC share decreased 70bps to 10.7%, the lowest level since October 2007
MPEL
MPEL’s lost 20bps of share in December to 13.5%, below their 6 month trailing share of 13.7% and their 2011 share of 14.8%.
- Altira’s share fell 10bps to 4.0%, above its 6M trailing share of 3.9% but below their 2011 share of 5.3%.
- Mass share ticked up 10bps to 1.4%
- VIP fell 20bps to 5.1%
- VIP RC share fell 20bps to 5.2%
- CoD’s share fell 10bps to 9.4%. December’s share was above the property’s 2011 and in-line with 6M trailing share of 9.3% and 9.5%, respectively.
- Mass market share was flat 11.7%, in-line with an all-time high for the property set in November
- VIP share was flat at 8.5%
- Junket share fell 90bps to 9.0%
SJM
SJM’s share fell 1.5% to 26.1%. December’s share compares to their 2011 average of 29.2% and its 6M trailing average of 26.5%.
- Mass market share fell 1.6% to 28.7%, an all-time company low
- VIP share dropped 1.4%to 26.0%
- Junket RC share increased 1.6% to 29.0%
GALAXY
Galaxy was the largest share gainer in December, increased 2% points to 18.2%, below its 6M trailing share average of 18.5%
- Galaxy Macau share increased 2.5% to 11.0%, positively impacted by 3.86% and an easy comparison in November
- Mass share increased 70bps to 9.8%
- VIP share increased 3.3% to 11.5%
- RC share grew 60bps to 10.2%, reversing 6 consecutive months of share declines
- Starworld share fell 30bps to 6.2%
- Mass share increased 90bps to 3.5%
- VIP share fell 90bps to 7.3%
- RC share increased 10bps to 8.7%
MGM
MGM gained 1.3% share to 10.9% in December, above their 6M average of 9.7% and above their 2011 share of 10.5%.
- Mass share increased 1.2% to 8.1%
- VIP share grew 1.6% to 11.9%
- Junket RC fell 90bps to 10.5%
Slot Revenue
Slot revenue grew 7% YoY to $145MM in December.
- LVS took the top prize for YoY growth of 49% to $49MM
- Galaxy’s slot revenue grew 26% to $19MM, also setting a company record
- MPEL grew 3% YoY to $24MM
- MGM slot revenues fell 8% to $20MM
- WYNN fell 18% to $19MM
- SJM had the worst YoY performance in slots with a 29% YoY decline to $14MM