Key Takeaways
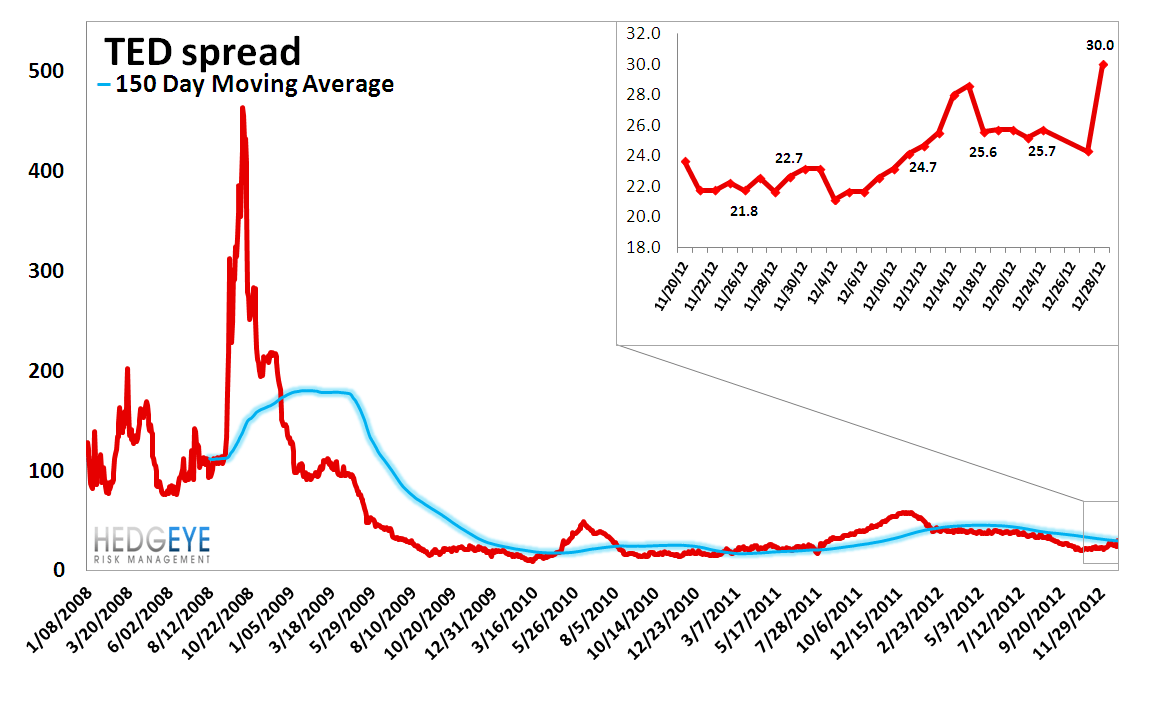
* TED Spread: The TED spread posted another notable increase last week, rising 5 bps to 30 bps. The move came principally from the Treasury side, where yields at the short end compressed notably week-over-week. This series has been quietly breaking out after a long hibernation, which historically has been a warning sign.
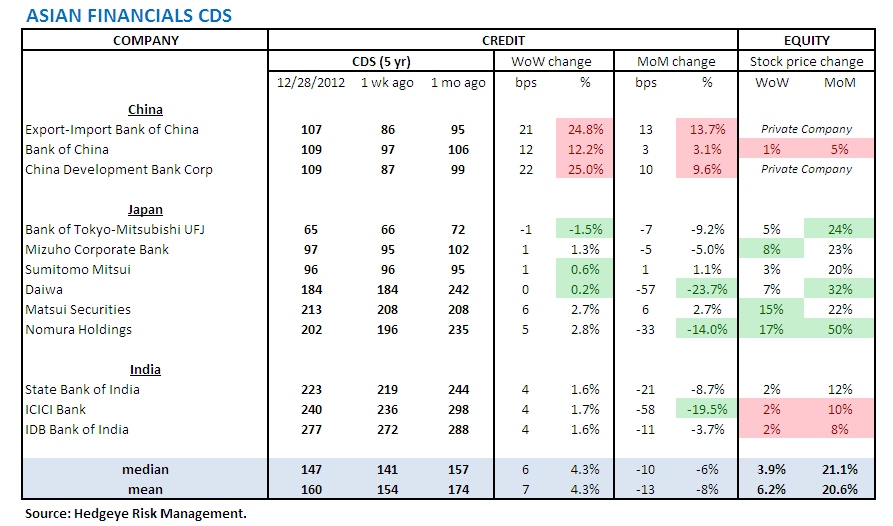
* Chinese Banks: Chinese banks were conspicuously wider last week. China Development Bank widened 22 bps to 109 bps, while Export-Import Bank of China widened 21 bps to 107 bps. Bank of China was also wider by 12 bps to 109 bps.
* Japanese Sovereign Swaps: The only notable move in sovereign swaps last week was Japan, widening by a further 8 bps, bringing the two week move to 13 bps. While that may not sound like a lot, it's off a base of 69 bps. Clearly, linking fiscal control to monetary policy explicitly has the market concerned (finally) about longer-term solvency issues.
* High Yield: The average rate on high yield corporate debt rose 50 bps week-over-week from 6.28% to 6.77%
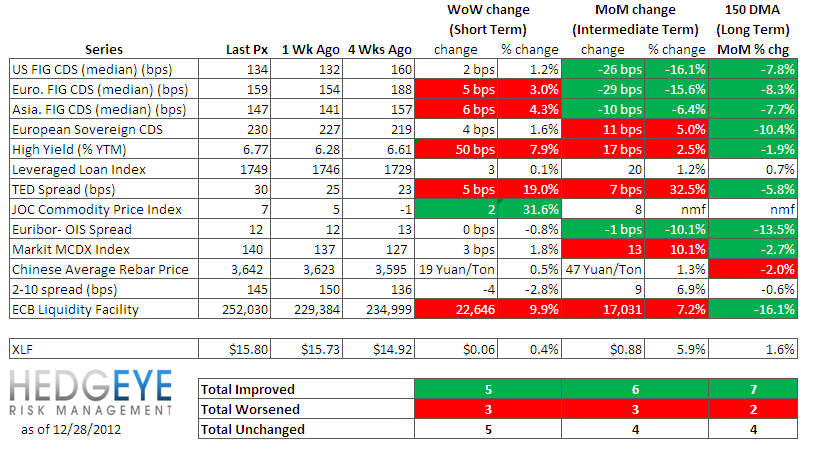
Financial Risk Monitor Summary
• Short-term(WoW): Negative / 1 of 12 improved / 5 out of 12 worsened / 7 of 12 unchanged
• Intermediate-term(WoW): Negative / 4 of 12 improved / 5 out of 12 worsened / 4 of 12 unchanged
• Long-term(WoW): Positive / 9 of 12 improved / 1 out of 12 worsened / 3 of 12 unchanged
1. American Financial CDS – Large cap banks and brokers were all wider last week, rising by an average of 5 bps. MS was the laggard with a 10 bps rise. Meanwhile, mortgage insurers MTG and RDN continue to tighten on the housing recovery. Swaps for the two remaining pure-play MIs are tighter by just under 200 bps month-over-month, though their swaps are still in the range. Insurance swaps were largely flat week over week with the exception of bond guarantor MBIA, which widened by 50 bps.
Widened the most WoW: C, MS, WFC
Tightened the most WoW: RDN, MTG, ALL
Widened the most/ tightened the least MoM: MBI, SLM, WFC
Tightened the most WoW: GNW, AIG, RDN

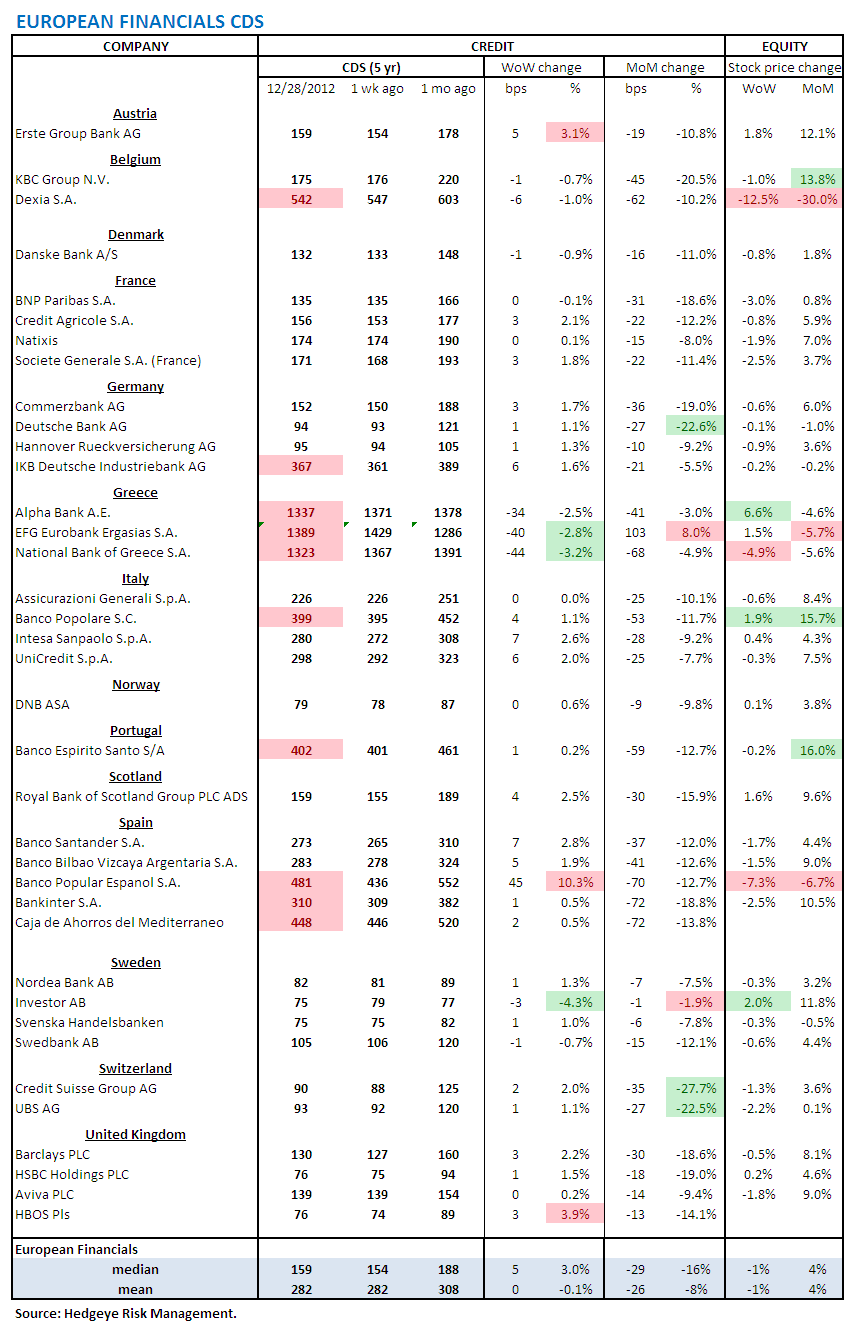
2. European Financial CDS – Banco Popular of Spain widened by 45 bps to 481 bps, making it the largest mover on the week. The only notable tightening came from Greece's banks, which saw spreads compress by an average of 39 bps, albeit off of very high levels. The rest of Europe's banks were largely uneventful last week.
3. Asian Financial CDS – Chinese banks were conspicuously wider last week. China Development Bank widened 22 bps to 109 bps, while Export-Import Bank of China widened 21 bps to 107 bps. Bank of China was also wider by 12 bps to 109 bps. Japanese financials were largely unchanged week over week, as were Indian banks.
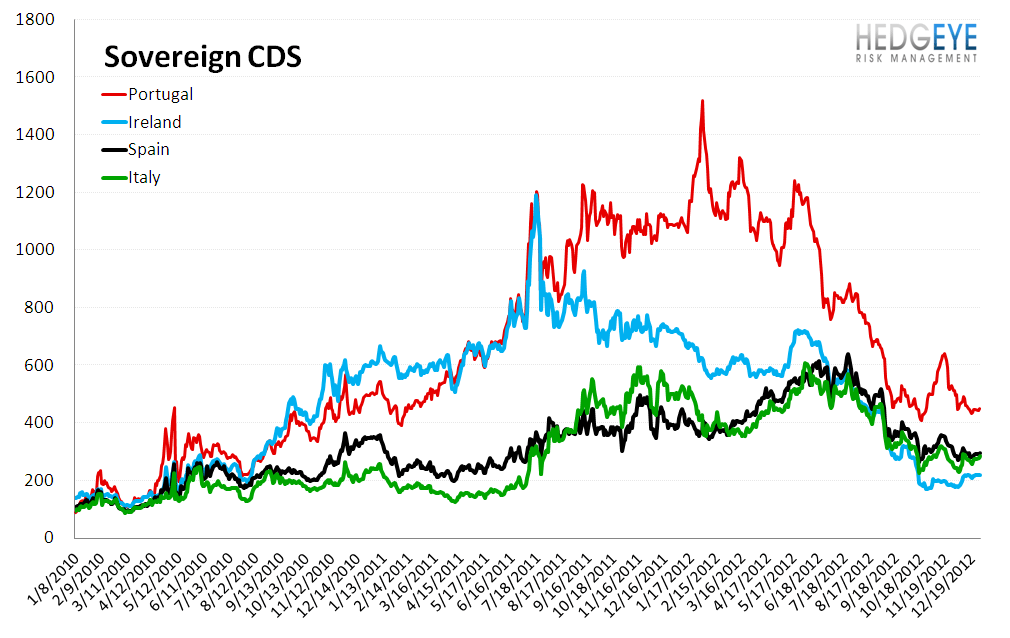
4. Sovereign CDS – The only notable move in sovereign swaps last week was Japan, widening by a further 8 bps. In the prior week, Japan widened by 5 bps. Japanese sovereign CDS have moved from 69 bps to 81 bps in two weeks on the heels of an explicit linking of fiscal control to monetary policy, which is an interesting development worth keeping an eye on. European sovereign swaps were broadly higher last week, though only by a few basis points. Italy widened by 9 bps, making it the most noteworthy EU sovereign in an otherwise uninteresting week.


5. High Yield (YTM) Monitor – High Yield rates rose 50 bps last week, ending the week at 6.77% versus 6.28% the prior week.

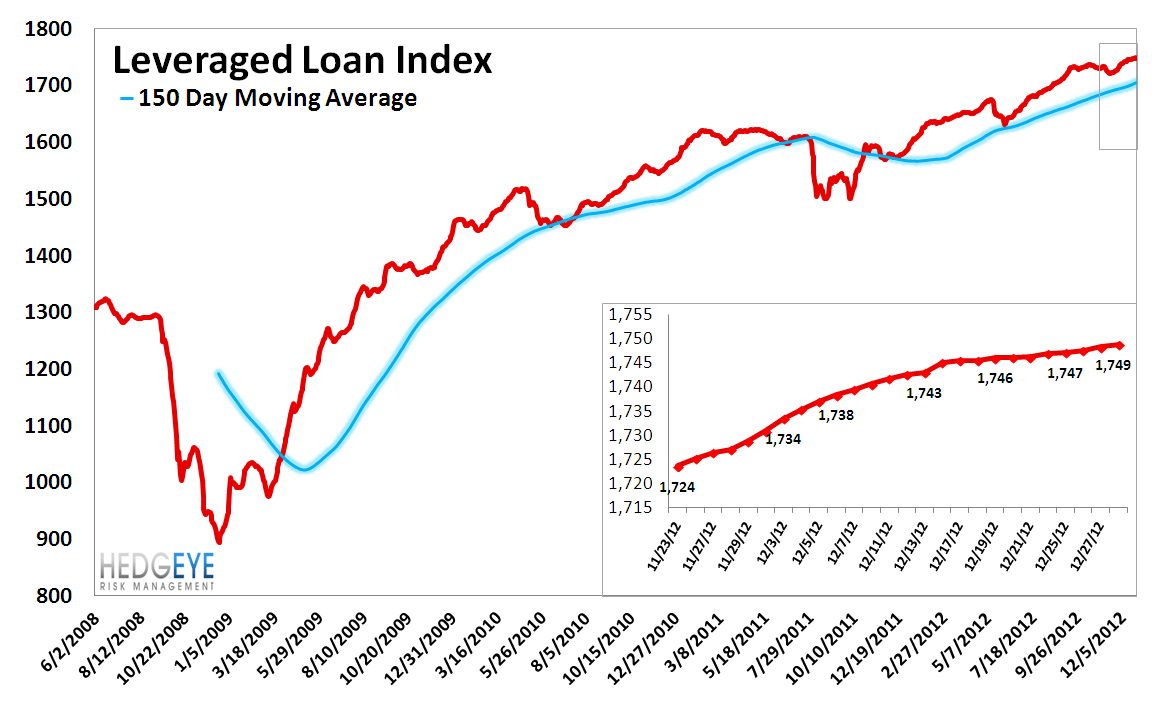
6. Leveraged Loan Index Monitor – The Leveraged Loan Index rose 2.5 points last week, ending at 1749.
7. TED Spread Monitor – The TED spread rose 5 bps last week, ending the week at 30 bps this week versus last week’s print of 25 bps.
8. Journal of Commerce Commodity Price Index – The JOC index rose 1.6 points, ending the week at 6.7 versus 5.1 the prior week.

9. Euribor-OIS spread – The Euribor-OIS spread tightened by less than 1 bp to 12 bps. The Euribor-OIS spread (the difference between the euro interbank lending rate and overnight indexed swaps) measures bank counterparty risk in the Eurozone. The OIS is analogous to the effective Fed Funds rate in the United States. Banks lending at the OIS do not swap principal, so counterparty risk in the OIS is minimal. By contrast, the Euribor rate is the rate offered for unsecured interbank lending. Thus, the spread between the two isolates counterparty risk.

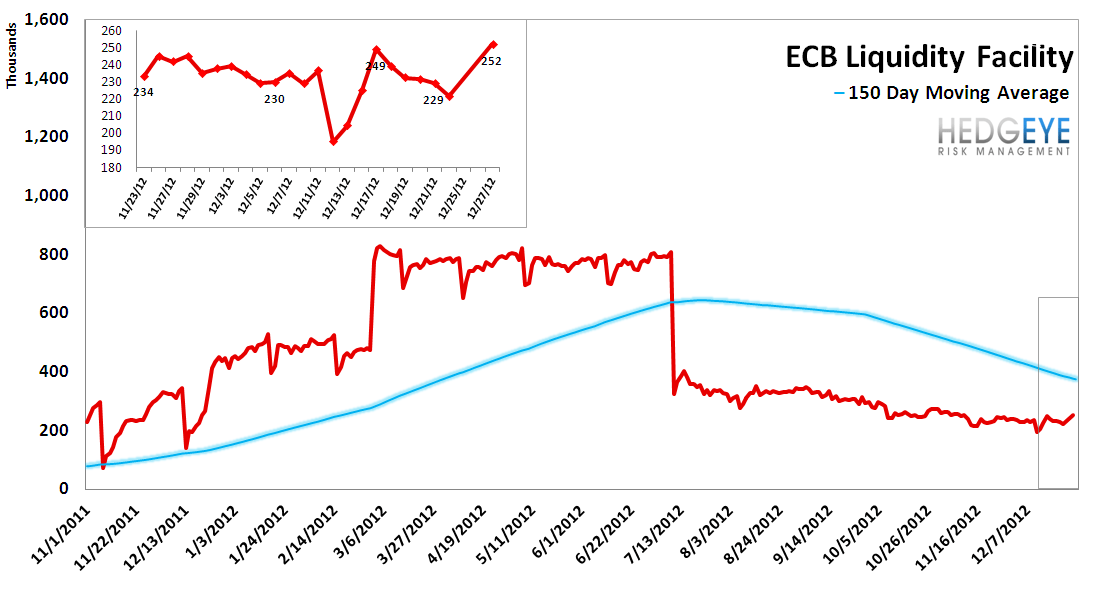
10. ECB Liquidity Recourse to the Deposit Facility – The ECB Liquidity Recourse to the Deposit Facility measures banks’ overnight deposits with the ECB. Taken in conjunction with excess reserves, the ECB deposit facility measures excess liquidity in the Euro banking system. An increase in this metric shows that banks are borrowing from the ECB. In other words, the deposit facility measures one element of the ECB response to the crisis.
11. Markit MCDX Index Monitor – Last week spreads widened , ending the week at 140 bps versus 137 bps the prior week. The Markit MCDX is a measure of municipal credit default swaps. We believe this index is a useful indicator of pressure in state and local governments. Markit publishes index values daily on six 5-year tenor baskets including 50 reference entities each. Each basket includes a diversified pool of revenue and GO bonds from a broad array of states. We track the 16-V1.

12. Chinese Steel –Steel prices in China rose 0.5% last week, or 19 yuan/ton, to 3642 yuan/ton. Since their recent highs on Oct 10, Chinese construction steel prices have fallen ~4.9%. The broader downward trend, which started August of last year, remains intact and is a sign of ongoing weakness in the Chinese construction market. We use Chinese steel rebar prices to gauge Chinese construction activity, and, by extension, the health of the Chinese economy.

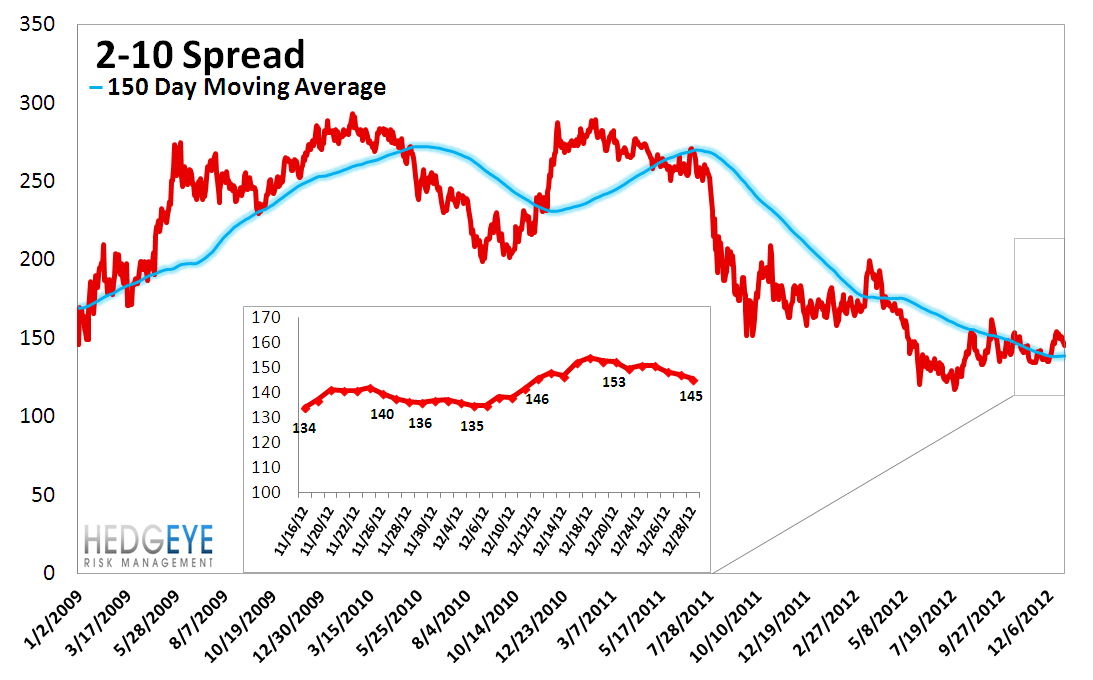
13. 2-10 Spread – We track the 2-10 spread as an indicator of bank margin pressure. Last week the 2-10 spread tightened to 145 bps, -4 bps tighter than a week ago.
14. XLF Macro Quantitative Setup – Our Macro team’s quantitative setup in the XLF shows 0.9% upside to TRADE resistance and 0.3% downside to TRADE support.

Margin Debt – November: +1.37 Standard Deviations
NYSE Margin debt rose to $327 billion in November from $318 billion in October. We like to to look at margin debt levels as a broad contrarian sentiment indicator. For reference, our approach is to look at margin debt levels in standard deviation terms over the period 1. Our analysis finds that when margin debt gets to +1.5 standard deviations or greater, as it did in April of 2011, it has historically been a signal of significant risk in the equity market. The preceding two instances were followed by the equity market losing roughly half its value over the following 24-36 months. Overall this setup represents a long-term headwind for the market. One limitation of this series is that it is reported on a lag. The chart shows data through November.

Joshua Steiner, CFA
Robert Belsky
