Quantifying NY, NJ and PA
Last week we urged investors to remain calm in anticipation of what we thought would be mean reversion over the coming two months. This morning's 41k decline in initial claims is a good down payment on that mean reversion. We got the state level data on a one week lag, so now we can evaluate where the surge in claims last week came from. In short, they came from NY, NJ and PA. To put some numbers around it, total non-seasonally adjusted initial jobless claims rose by 116,743 two weeks ago. New York accounted for 43,956 of that, or 37.7%, but New York represents just 6.2% of the U.S. population. New Jersey accounted for 31,094 of the increase, or 26.6%, but represents just 2.8% of the population. Pennsylvania, meanwhile had an increase of 7,037 initial claims, which was 6.0% of the total, despite being just 4.0% of the U.S. population. Taken together, these three states, NY, NJ and PA, accounted for 70.3% of the total increase in jobless claims two weeks ago following Hurricane Sandy, while those same three states represent 13.0% of the U.S. population. We think it's fair to say that Hurricane Sandy was clearly responsible for surge in claims.
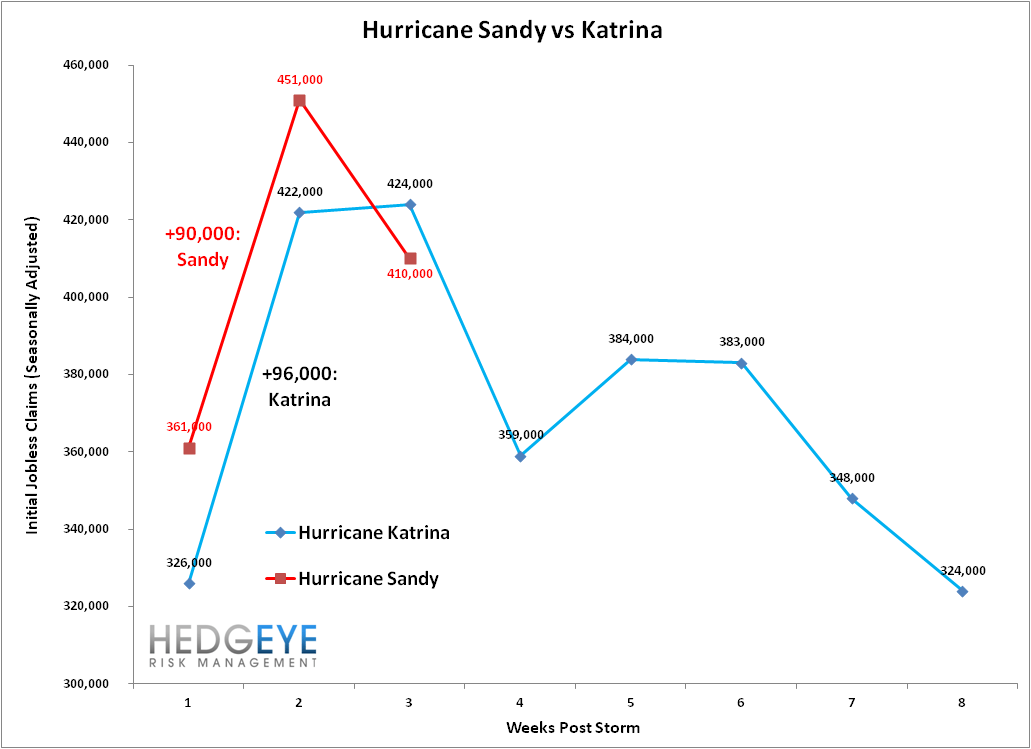
In the first chart below we update our plot of seasonally-adjusted claims comparing the effects of Hurricanes Katrina and Sandy. We expect the path of Hurricane Katrina will be a reasonable proxy for what to expect over the coming six weeks from Hurricane Sandy.
The Data
Initial claims fell 29k last week to 410k (but fell 41k after the 10k upward revision to last week's data). Rolling claims rose 9.5k WoW to 396k. Non-seasonally-adjusted claims were lower by 81k WoW.


Yield Spreads
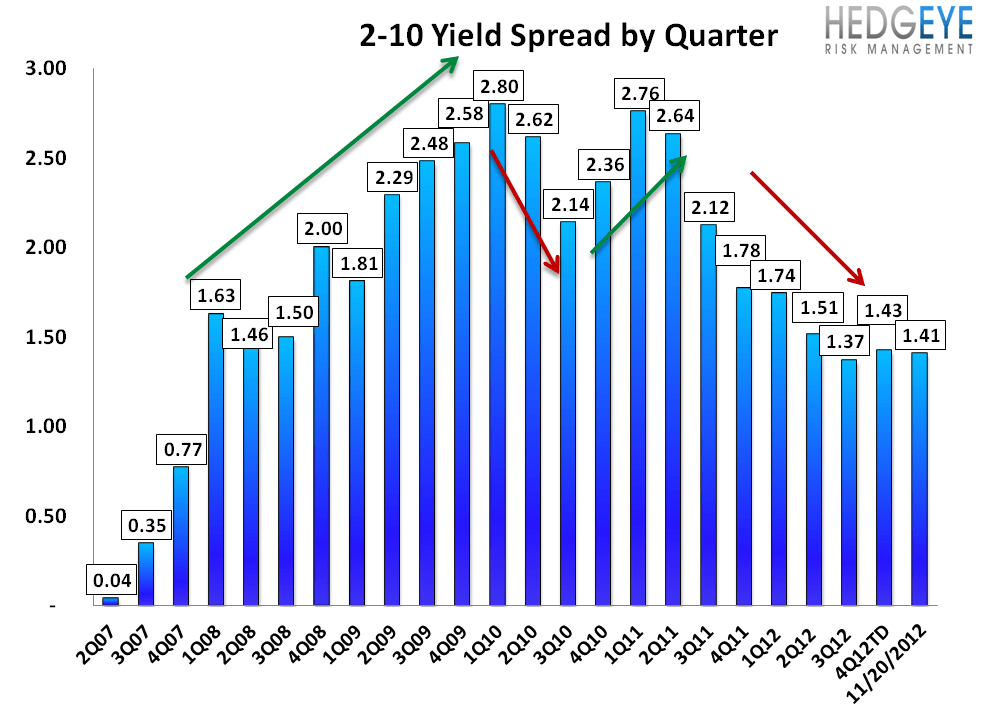
The 2-10 spread rose 7 bps WoW to 140 bps with all the improvement coming from the 10-year. The 2-year was flat. So far 4QTD, the 2-10 spread is averaging 1.43%, which is up 6 bps relative to 3Q12.
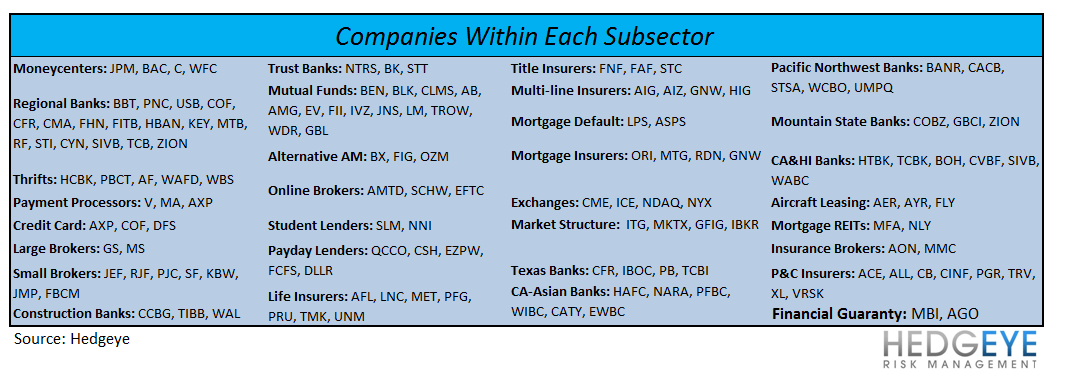
Financial Subsector Performance
The table below shows the stock performance of each Financial subsector over multiple durations.

Joshua Steiner, CFA
Robert Belsky