Perceived Employment Progressing As Expected
This morning's 9k decrease in initial jobless claims (seasonally-adjusted) keeps the series on track with the improvement we expect to see from September through February. The slope is flatter thus far than the six-month averages seen over the past few years, but in looking at the prior years the improvements have tended to accelerate over the last four months (November through February) relative to September/October. While this is our baseline assumption, we would emphasize that the forward path hinges largely on the resolution of the Fiscal Cliff, which we regard as being closely tied to the outcome of the election.
What's Really Going On?
We're more interested in the rate of YoY change in the rolling NSA series, as that's the better indicator of how the labor market is really doing. That measure showed slight moderation WoW to -8.8% YoY vs. -9.1% in the preceding week (a lower number reflects better health in the labor market). Two weeks ago, the YoY change was -8.9%. As such, the series is slightly worse WoW, but we tend not to put too much emphasis on a single week.
The Data
Last week, seasonally-adjusted initial jobless claims fell 6k to 363k. However, after incorporating the 3k upward revision to the prior week's data, claims fell by 9k. Rolling claims fell 1.5k WoW to 367k. On a non-seasonally adjusted basis, claims fell 5k to 340k.
Separately, the divergence between the S&P 500 and initial jobless claims has largely disappeared over the past month with the sell-off in equities and the improvement in claims, suggesting we're much closer to fair value at these levels.


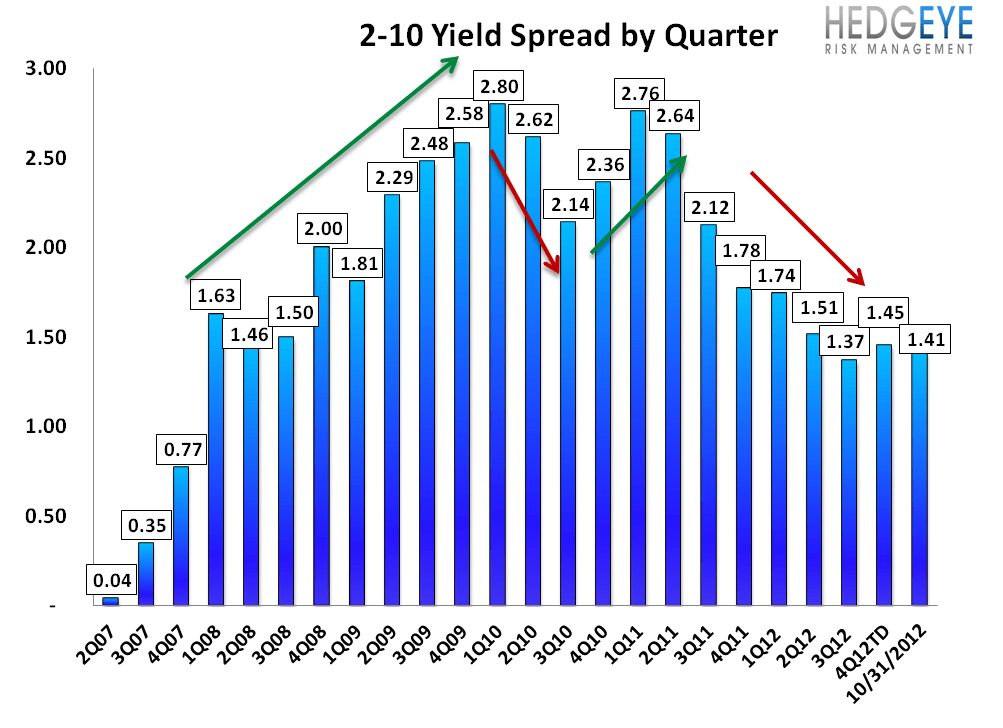
Yield Spreads
The 2-10 spread fell 9 bps WoW to 141 bps. So far 4QTD, the 2-10 spread is averaging 1.45%, which is up 8 bps relative to 3Q12.

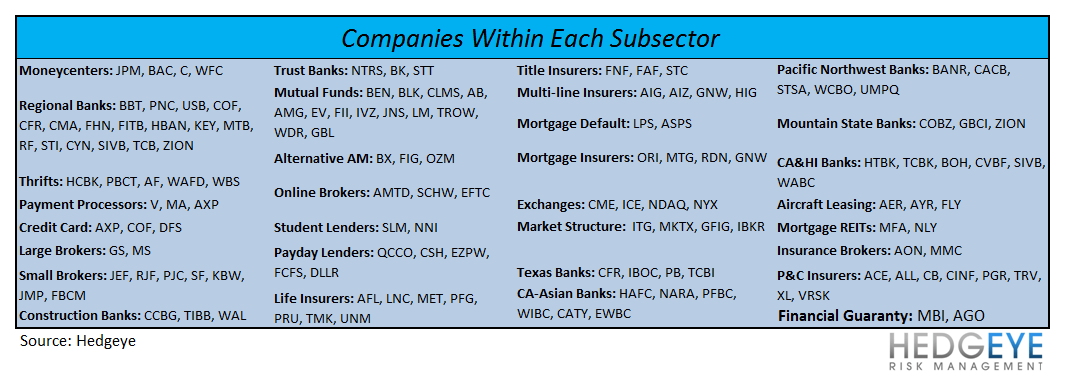
Financial Subsector Performance
The table below shows the stock performance of each Financial subsector over multiple durations.

Joshua Steiner, CFA
Robert Belsky
