We are republishing a note from three weeks ago that outlined our bearish view on casual dining. Incremental data emerging today is suggesting that casual dining comparable sales growth may be decelerating further in October from September’s trends. With Brinker highlighting adverse macro conditions and BJ’s Restaurants echoing those sentiments today after the close, we believe that it is worth reiterating our negative stance on the category. Our favorite ways to play this theme is short BLMN, TXRH, DRI, and BWLD.
Casual Dining Caution
We continue to believe that consensus is far too bullish on casual dining top-line trends. Anemic real wage growth is just one of many macroeconomic headwinds that we believe merit caution going forward. The Restaurant Value Spread, as we wrote about here, is suggesting that inflation at restaurants outstripping inflation at grocery stores may be having an adverse impact on same-restaurant sales growth this year.
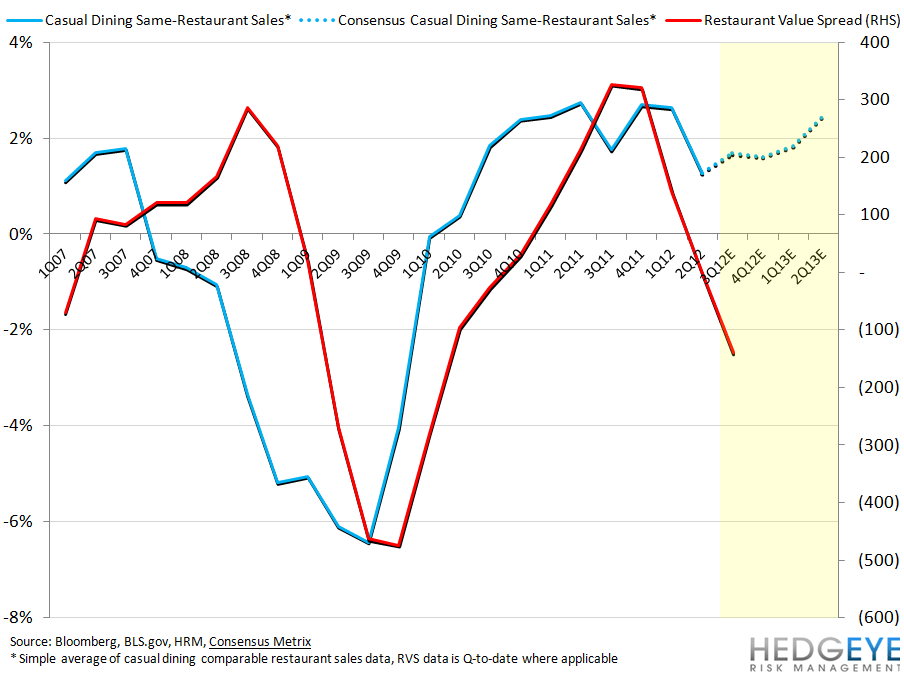
The casual dining sales index, shown below, is a simple average of a broad selection of casual dining companies’ same-restaurant sales data. The Knapp Track Index, which we are not permitted to illustrate directly in chart form, leads the index depicted below (correlation=0.96).
HOWARD PENNEY: RELATIVE VALUE MATTERS FOR CASUAL DINING 10/03/2012 07:42 AM
Internally, and within regular posts, we have been discussing the spread between the year-over-year growth rates of the Bureau of Labor Statistics’ CPI for Food at Home and CPI for Food Away from Home metrics for some time. Initially, our analysis focused on the spread as being relevant for companies’ pricing strategies but we also believe that the spread, which we call the Restaurant Value Spread, is a driver of traffic for the restaurant industry. The Restaurant Value Spread goes some way to explaining the resilience in restaurant industry sales trends in 2011. The spread effectively represents the relative rate of inflation between grocers and restaurants. In 2011, rampant food inflation was passed on to consumers by supermarket chains but not, to the same extent, by restaurants. We believe this buoyed traffic trends within the restaurant industry, particularly casual dining. Empirical data suggests that the spread turning negative may not bode well for casual dining trends from here. Additionally, the Street is expecting a positive turn in casual dining trends that we believe is looking less and less likely.
Below is a chart of a Casual Dining Same-Restaurant Sales Index, comprised of a simple average of the comps of twenty-one casual dining concepts, versus the Restaurant Value Spread. The dotted line represents what consensus expectations imply for the Index over the next four quarters. We believe that many factors are working against casual dining from here: over-supply, food inflation, energy inflation, negative traffic, employment trends, and anemic real earnings growth are several of the key headwinds we are concerned about. Relative value is another metric that we are watching closely. The chart below implies that, if relative value impacts “share of stomach” within the food industry, casual dining same-restaurant sales growth expectations from here could be overly bullish.

The Restaurant Value Spread also tracks quite closely with the Knapp Track Casual Dining Same-Restaurant Traffic Index over time. Additionally, the same-restaurant sales trends of several companies within casual dining track closely with the Restaurant Value Spread. Below, we discuss two stocks that we think are topical at the moment, within casual dining, and offer commentary on our current thoughts and what meaning, if any, we take away from charts of their respective sales trends versus the Restaurant Value Spread.
Brinker has been one of our favorite names in the restaurant space over the past 2.5 years. The stock has provided some handsome returns to shareholders over that period as investor sentiment, while investor sentiment has been dramatically improved. That sell-side bearishness peaked in April ’12, well into the stock’s rally, tells us how entrenched the negative view of Brinker was on Wall Street. That said, there are still several factors that we believe are working in the company’s favor. We like EAT on the long side versus its peers, especially TXRH, DRI, DIN, and BWLD. Some additional factors worth bearing in mind:
- The Restaurant Value Spread chart (below) indicated that same-restaurant sales expectations may be overly bullish for Chili’s. The correlation, historically, is not consistent and we believe Chili’s is taking share via its new sales layers (pizza) and strong-performing remodels (~5% comps). That said, it is likely that an erosion of the value proposition Chili's represents versus supermarkets and/or its peers will impact its same-restaurant sales numbers.
- Chili’s has invested in its kitchen technology and, in our view, should reap significant rewards relative to the competition over the coming quarters and, possibly, years. Applebee’s has been turning to non-scalable sales initiatives like 24 hour opening and “Club Applebee’s”; we are confident that Chili’s investing in technology and service initiatives has generated, and will continue to generate, strong sales versus the industry.

Texas Roadhouse is a stock that we are negative on given its position within a highly-competitive segment at a time when we expect tough top-line compares to impact the stock in the coming quarters. Additionally, aggressive discounting by a newly-public competitor is likely pressuring same-restaurant sales. We believe that earnings revisions are unlikely to rise from here, as we wrote in our 9/19 note, “TXRH: WHERE TO FROM HERE?” Sales growth lagging capex growth and beef inflation pressuring margins should, in our view, depress returns going forward. As CFO Price Cooper said on the 2Q call, “While our newer restaurants continue to open strong, as they move through the honeymoon period and their sales normalize, their base is slightly less than existing restaurants.” We believe that there is risk to the stock’s multiple if returns decline.
- We view Texas Roadhouse as being one concept that the Restaurant Value Spread is especially relevant for. To the extent that the Restaurant Value Spread being north of 300 bps wide last year may have driven consumers from Kroger to Texas Roadhouse for steak dinners, we expect the collapse in that spread to negative territory to have an adverse impact this year.

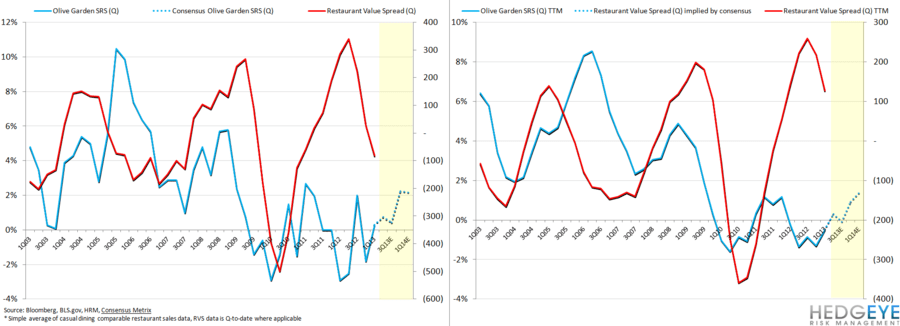
Darden is a stock that we have been negative on for some time. Please email us for a copy of our recent Blackbook detailing our thesis. The company’s recent $0.02 beat was supported by an unusually low tax rate ($0.02-0.03) as well as expanded marketing and promotional initiatives. Operating profit missed consensus expectations. Given the low quality nature of the 1QFY13 beat, our continued conviction in our thesis, and consensus continuing to show unwarranted faith in Olive Garden sales rebounding, we retain a negative view of Darden’s stock at these levels.
- Casual Dining same-restaurant sales trends were strong in 2011, benefitting in part from the relative value that the category represented for consumers versus the grocery aisle where inflation was running at 6% year-over-year. That Olive Garden was left behind by this upward surge in casual dining trends is telling. We are not in agreement with consensus that Olive Garden comps will turn sharply higher from here. As the second chart (below) indicates, traffic trends have not been moving in a positive direction.

Howard Penney
Managing Director
Rory Green
Analyst