Key Takeaways
* American bank default swaps have tightened significantly. The improvement seems to be the result of ongoing improvement in housing as well as reasonably strong earnings.
* European bank CDS also tightened across the board last week with only 1 out of the 37 reference entities we track widening. This is a bit surprising considering that the EU Summit failed to produce any tangible solutions once again.
* Sovereign swaps around the globe moved sharply lower, mirroring the move in bank swaps.
* Steel prices in China have generally been trending lower since August of last year. Prices have fallen 13% over the last six months but are up 1.3% MoM.
* The MCDX, our preferred measure of municipal default risk, tightened WoW
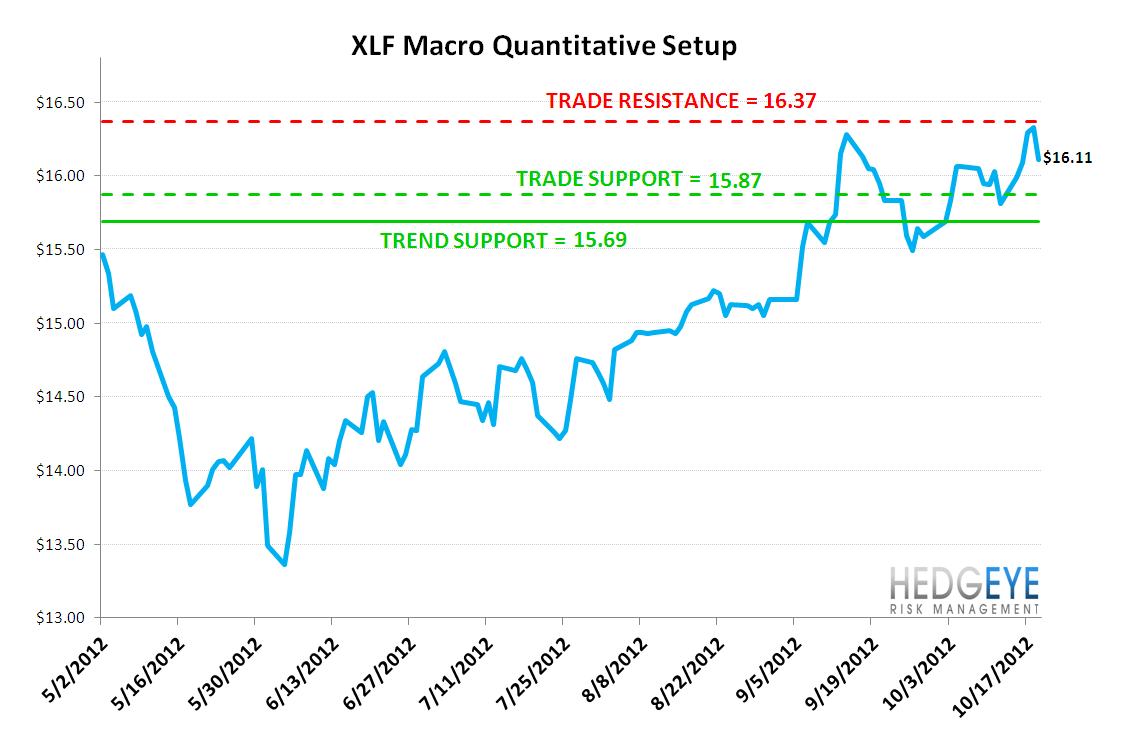
* Our Macro team’s quantitative setup in the XLF shows 1.6% upside to TRADE resistance and 1.5% downside to TRADE support.
Financial Risk Monitor Summary
• Short-term(WoW): Positive / 5 of 12 improved / 1 out of 12 worsened / 7 of 12 unchanged
• Intermediate-term(WoW): Positive / 7 of 12 improved / 1 out of 12 worsened / 5 of 12 unchanged
• Long-term(WoW): Positive / 7 of 12 improved / 2 out of 12 worsened / 4 of 12 unchanged

1. American Financial CDS – A clean sweep. Swaps tightened for all the American financial reference entities we track. Considering the mixed reaction to earnings in the space, it's a notable divergence.
Tightened the most WoW: AXP, MS, BAC
Tightened the least WoW: WFC, COF, GS
Tightened the most MoM: RDN, HIG, MS
Widened the most MoM: MBI, WFC, LNC

2. European Financial CDS – Europe was not as good, only 36 of 37 reference entities improved. Spanish banks showed some of the sharpest improvement.

3. Asian Financial CDS – Asia took its cues from the U.S. and EU. Bank swaps in China and India were tighter WoW. Japanese banks were also generally tighter.

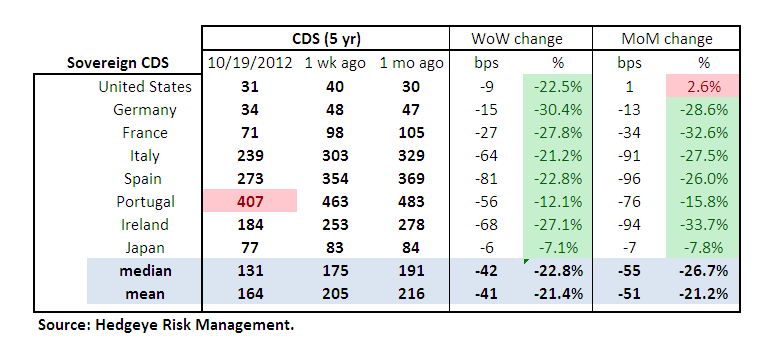
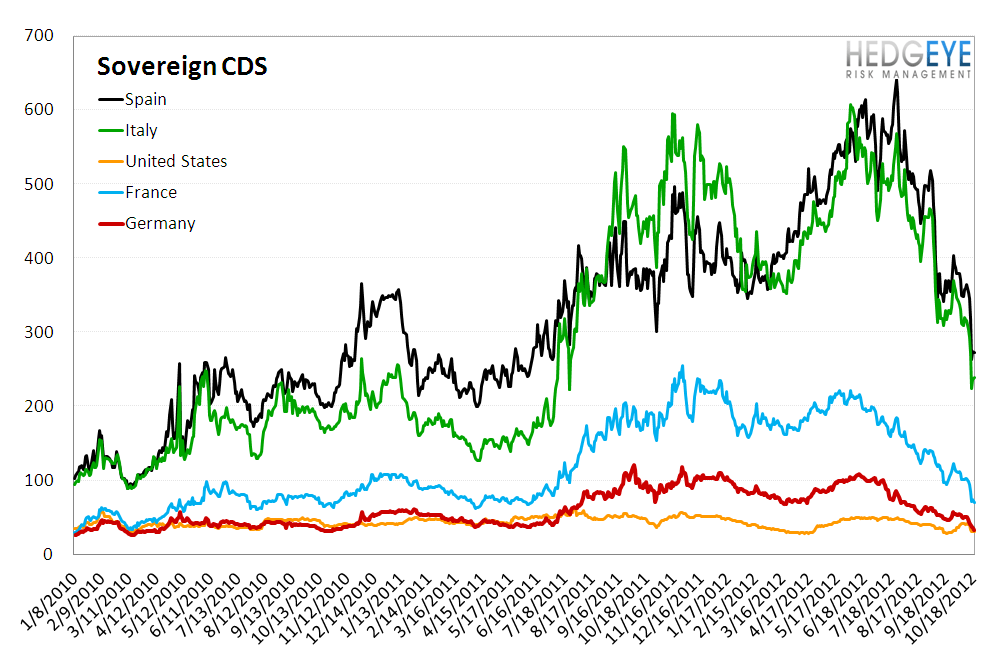
4. Sovereign CDS – Sovereign default swaps around the world moved sharply lower, with an average decline of 22.8%. Notable call outs include German sovereign swaps, which tightened by 30.4% (-15 bps to 34 bps) and Spanish sovereign swaps, which tightened by 81 bps to 273 bps.

5. High Yield (YTM) Monitor – High Yield rates fell 13.7 bps last week, ending the week at 6.52% versus 6.66% the prior week.

6. Leveraged Loan Index Monitor – The Leveraged Loan Index rose 0.7 points last week, ending at 1735.53.

7. TED Spread Monitor – The TED spread fell 1.2 bps last week, ending the week at 22.3 bps this week versus last week’s print of 23.5 bps.

8. Journal of Commerce Commodity Price Index – The JOC index fell -1.0 points, ending the week at -0.65 versus +0.4 the prior week.

9. Euribor-OIS spread – The Euribor-OIS spread tightened by 1 bp to 11 bps. The Euribor-OIS spread (the difference between the euro interbank lending rate and overnight indexed swaps) measures bank counterparty risk in the Eurozone. The OIS is analogous to the effective Fed Funds rate in the United States. Banks lending at the OIS do not swap principal, so counterparty risk in the OIS is minimal. By contrast, the Euribor rate is the rate offered for unsecured interbank lending. Thus, the spread between the two isolates counterparty risk.

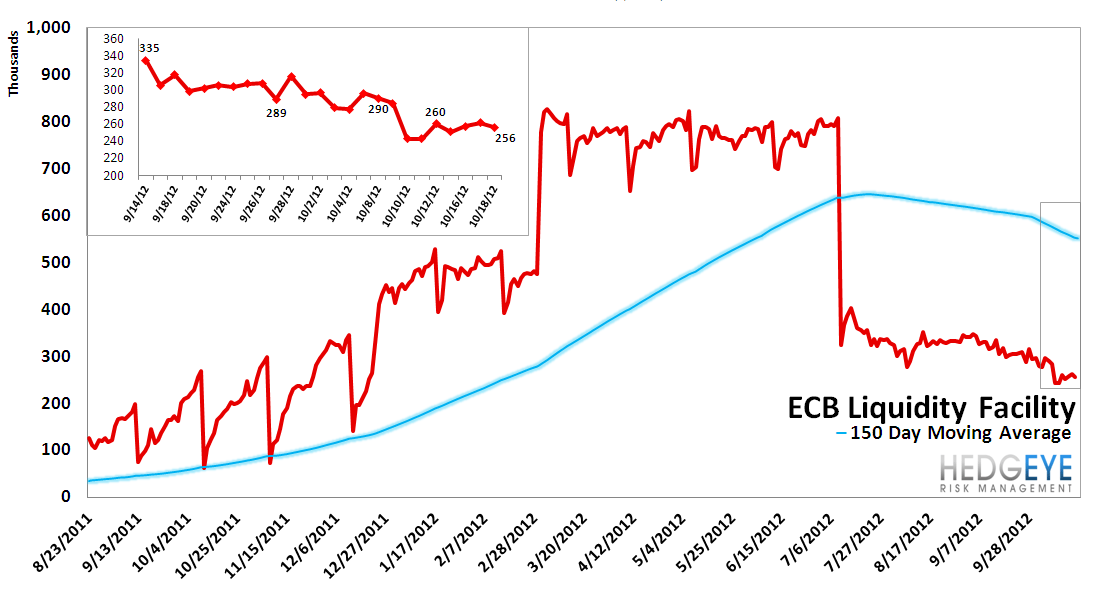
10. ECB Liquidity Recourse to the Deposit Facility – The amounts drawn under this facility have been steadily declining since July 2012. The ECB Liquidity Recourse to the Deposit Facility measures banks’ overnight deposits with the ECB. Taken in conjunction with excess reserves, the ECB deposit facility measures excess liquidity in the Euro banking system. An increase in this metric shows that banks are borrowing from the ECB. In other words, the deposit facility measures one element of the ECB response to the crisis.
11. Markit MCDX Index Monitor – Spreads tightened 6 bps, ending the week at 132 bps versus 138 bps in the prior week. The Markit MCDX is a measure of municipal credit default swaps. We believe this index is a useful indicator of pressure in state and local governments. Markit publishes index values daily on six 5-year tenor baskets including 50 reference entities each. Each basket includes a diversified pool of revenue and GO bonds from a broad array of states. We track the 16-V1.

12. Chinese Steel – Steel prices in China fell 1.6% last week, or 61 yuan/ton, to 3745 yuan/ton. Over the last six months, Chinese construction steel prices have fallen ~13%.This index is reflecting significant weakness in China's construction market.Chinese steel rebar prices have been generally moving lower since August of last year. We use Chinese steel rebar prices to gauge Chinese construction activity, and, by extension, the health of the Chinese economy.

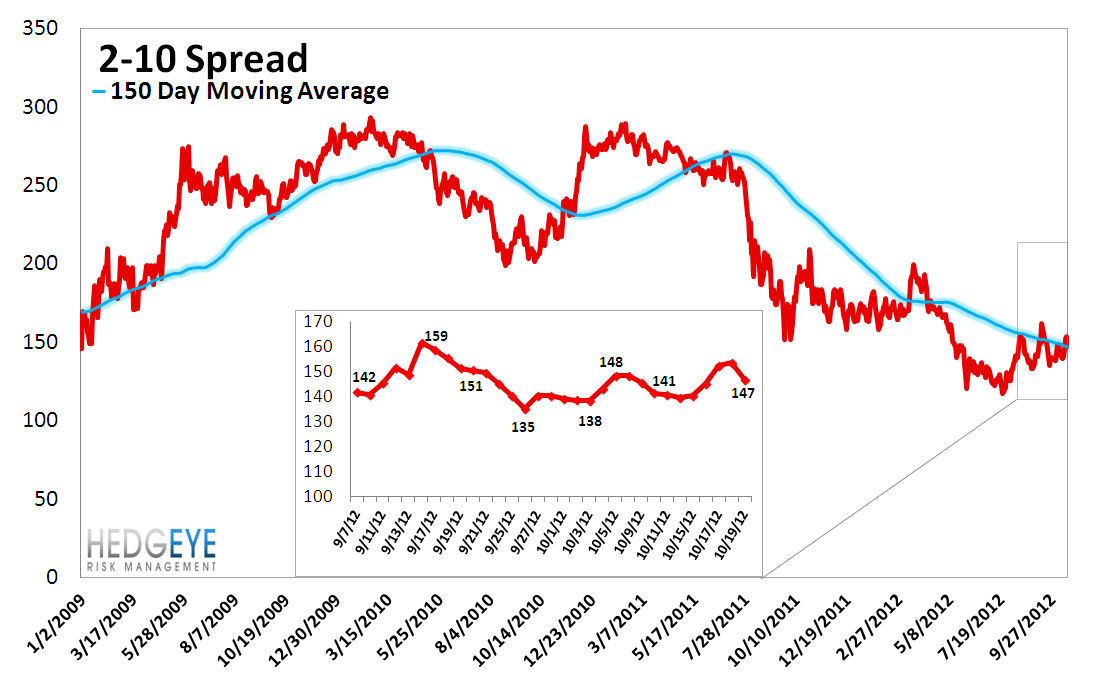
13. 2-10 Spread – Last week the 2-10 spread widened to 147 bps, 7 bps wider than a week ago. We track the 2-10 spread as an indicator of bank margin pressure.
14. XLF Macro Quantitative Setup – Our Macro team’s quantitative setup in the XLF shows 1.6% upside to TRADE resistance and 1.5% downside to TRADE support. At the moment, the XLF is both positive TRADE and TREND.
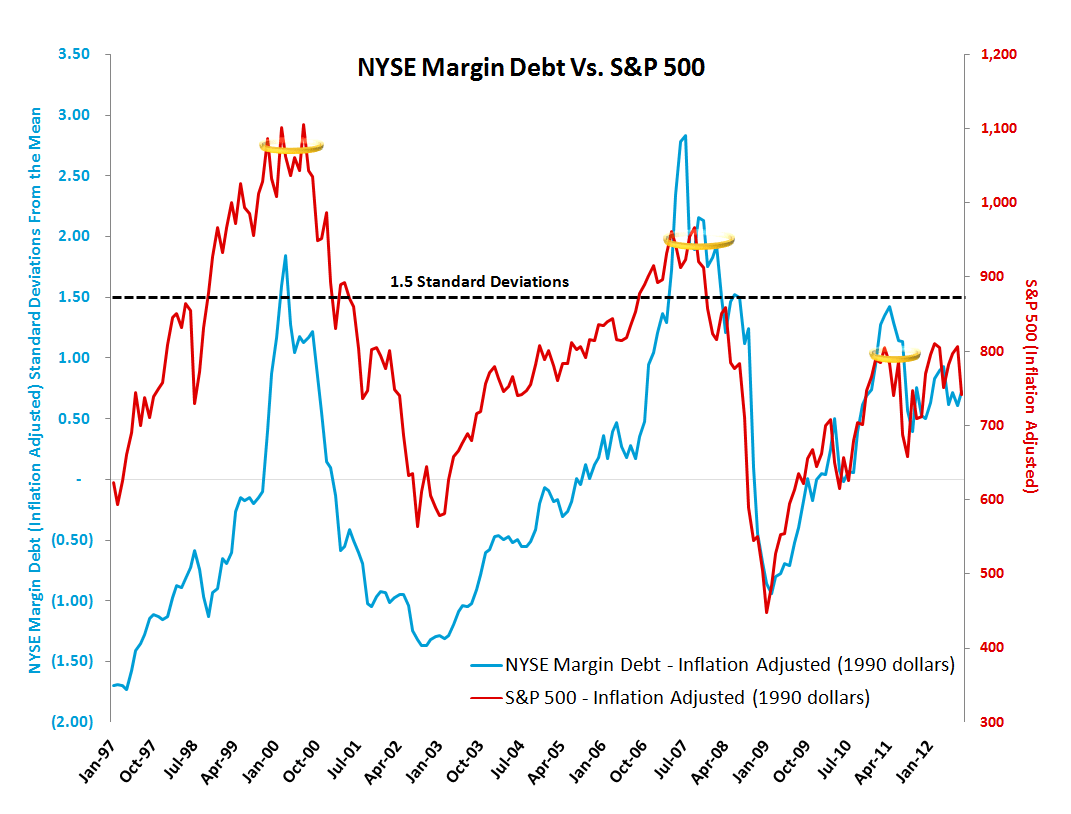
Margin Debt - August: +0.73 standard deviations
NYSE Margin debt rose to $287 billion in August from $278 billion in July. It's interesting to note that this most recent print brings the two series back into convergence. We like to to look at margin debt levels as a broad contrarian sentiment indicator. For reference, our approach is to look at margin debt levels in standard deviation terms over the period 1. Our analysis finds that when margin debt gets to +1.5 standard deviations or greater, as it did in April of 2011, it has historically been a signal of significant risk in the equity market. The preceding two instances were followed by the equity market losing roughly half its value over the following 24-36 months. Overall this setup represents a long-term headwind for the market. One limitation of this series is that it is reported on a lag. The chart shows data through August.
Joshua Steiner, CFA
Robert Belsky
Having trouble viewing the charts in this email? Please click the link at the bottom of the note to view in your browser.
