Key Takeaways
* American financial swaps were generally wider last week, while European financial swaps were mostly tighter.
* Sovereign Swaps around the world were largely flat week-over-week with the largest single move coming from Ireland, where swaps tightened 28 bps to 253 bps. Spain and Portugal saw their swaps widen by 4 and 8 bps, respectively, while France and Italy saw their swaps tighten by 4 and 8 bps, respectively.
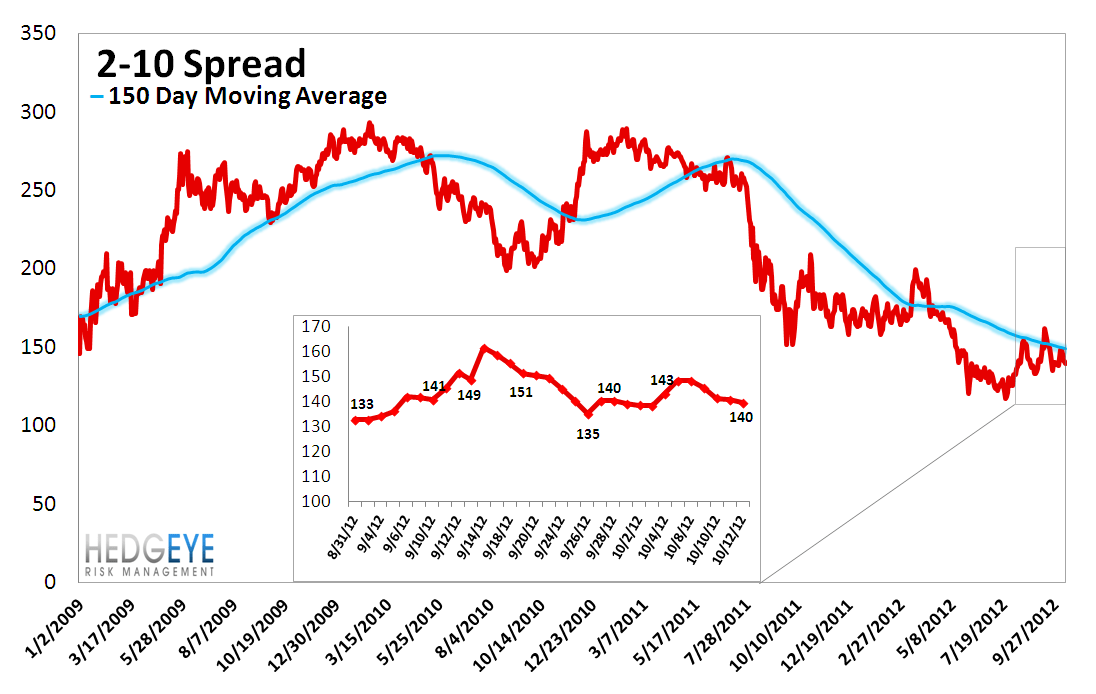
* The 2-10 spread continued to fall last week, declining ~9 bps to end the week at 140 bps. As WFC reminded us on Friday with its 25 bps QoQ NIM decline, it's hard to fight the gravity of falling long-term rates.
* Even-Steven. Our Macro team’s quantitative setup in the XLF shows 0.8% upside to TRADE resistance and 0.8% downside to TREND support.
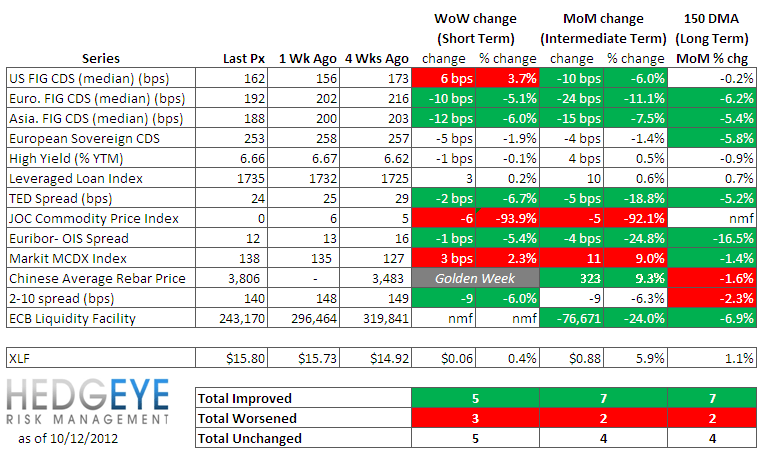
Financial Risk Monitor Summary
• Short-term(WoW): Positive / 9 of 12 improved / 1 out of 12 worsened / 3 of 12 unchanged
• Intermediate-term(WoW): Positive / 8 of 12 improved / 2 out of 12 worsened / 3 of 12 unchanged
• Long-term(WoW): Positive / 8 of 12 improved / 2 out of 12 worsened / 3 of 12 unchanged
1. American Financial CDS – Money center banks and large brokers saw their swaps widen between 4 and 8 bps, respectively, with the exception of MS, where swaps tightened 1 bp. The median US Financial swap widened by 6 bps, and, overall, swaps widened for 16 out of 27 domestic financial institutions.
Widened the most WoW: MTG, WFC, BAC
Tightened the most WoW: HIG, ALL, PRU
Widened the most MoM: WFC, MBI, AXP
Tightened the most WoW: HIG, AIG, UNM

2. European Financial CDS – It was a fairly uneventful week for default swap action on European banks. The trend was broadly lower (swaps tightened) with a median improvement of 10 bps WoW, and an average decline of 6 bps. Overall, 28 out of 37 European reference entities we track tightened.

3. Asian Financial CDS – Asian financial swaps were mixed last week, but generally went sideways.

4. Sovereign CDS – Sovereign Swaps around the world were largely flat week-over-week with the largest single move coming from Ireland, where swaps tightened 28 bps to 253 bps. Spain and Portugal saw their swaps widen by 4 and 8 bps, respectively, while France and Italy saw their swaps tighten by 4 and 8 bps, respectively.


5. High Yield (YTM) Monitor – High Yield rates fell 0.6 bps last week, ending the week at 6.66% versus 6.67% the prior week.

6. Leveraged Loan Index Monitor – The Leveraged Loan Index rose 3.1 points last week, ending at 1735.

7. TED Spread Monitor – The TED spread fell 2 bps last week, ending the week at 23.5 bps. Like Euribor-OIS, the TED Spread has moving steadily lower YTD.

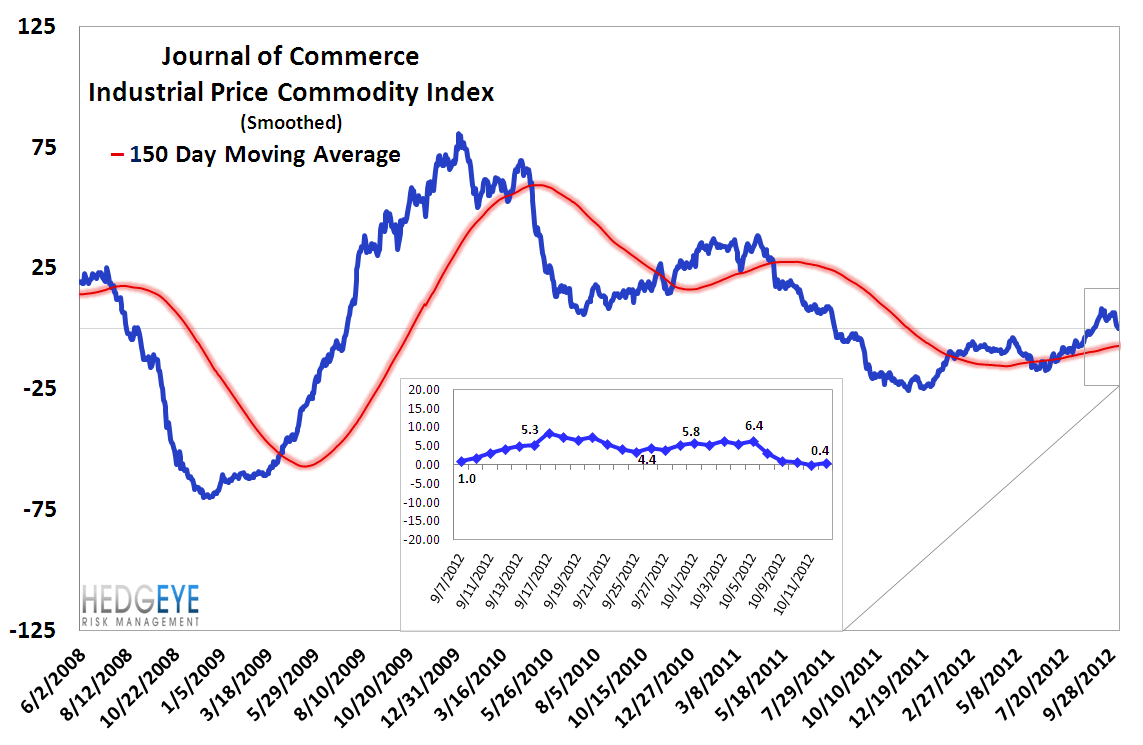
8. Journal of Commerce Commodity Price Index – The JOC index fell 6.0 points, ending the week at 0.4 versus 6.4 the prior week.
9. Euribor-OIS spread – The Euribor-OIS spread tightened by 1 bp to 12 bps, and continues to make new, multi-year lows. The Euribor-OIS spread (the difference between the euro interbank lending rate and overnight indexed swaps) measures bank counterparty risk in the Eurozone. The OIS is analogous to the effective Fed Funds rate in the United States. Banks lending at the OIS do not swap principal, so counterparty risk in the OIS is minimal. By contrast, the Euribor rate is the rate offered for unsecured interbank lending. Thus, the spread between the two isolates counterparty risk.

10. ECB Liquidity Recourse to the Deposit Facility – This series has been generally trending lower since July of this year. The ECB Liquidity Recourse to the Deposit Facility measures banks’ overnight deposits with the ECB. Taken in conjunction with excess reserves, the ECB deposit facility measures excess liquidity in the Euro banking system. An increase in this metric shows that banks are borrowing from the ECB. In other words, the deposit facility measures one element of the ECB response to the crisis.

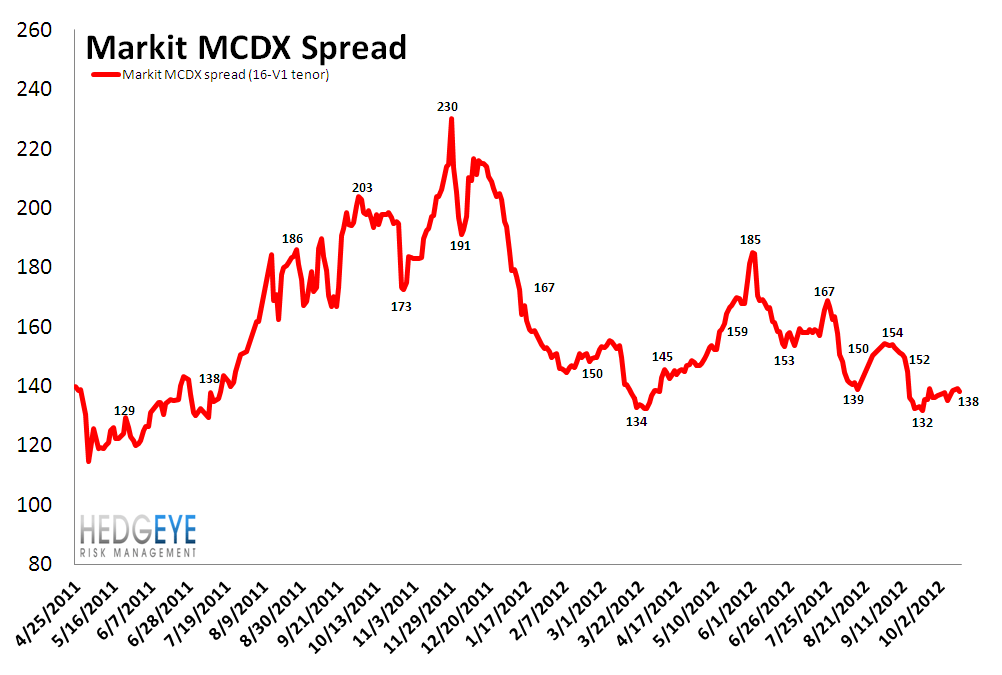
11. Markit MCDX Index Monitor – Last week spreads widened 3 bps, ending the week at 138 bps versus 135 bps the prior week. The Markit MCDX is a measure of municipal credit default swaps. We believe this index is a useful indicator of pressure in state and local governments. Markit publishes index values daily on six 5-year tenor baskets including 50 reference entities each. Each basket includes a diversified pool of revenue and GO bonds from a broad array of states. We track the 16-V1.
12. Chinese Steel – Chinese steel prices ended the week at 3,806 ton/Yuan. As a reminder, there were no Chinese steel quotes in the prior week because of the Mid-Autumn Festival holiday. The general trend over the last few months has been down. However, over the last month, Chinese Steel has rallied 9.3%.

13. 2-10 Spread – We track the 2-10 spread as an indicator of bank margin pressure. Last week the 2-10 spread tightened to 140 bps, 9 bps tighter than a week ago.
14. XLF Macro Quantitative Setup – Our Macro team’s quantitative setup in the XLF shows 0.8% upside to TRADE resistance and 0.8% downside to TREND support.

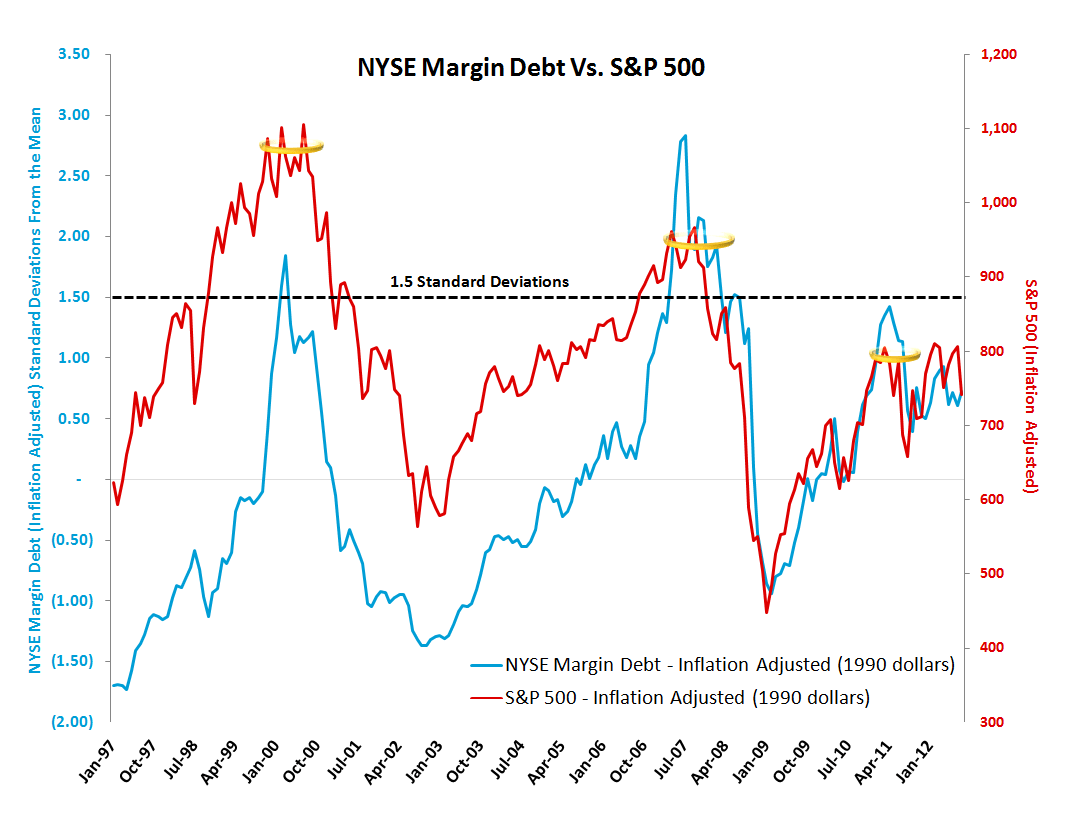
Margin Debt - August: +0.73 standard deviations
NYSE Margin debt rose to $287 billion in August from $278 billion in July. It's interesting to note that this most recent print brings the two series back into convergence. We like to to look at margin debt levels as a broad contrarian sentiment indicator. For reference, our approach is to look at margin debt levels in standard deviation terms over the period 1. Our analysis finds that when margin debt gets to +1.5 standard deviations or greater, as it did in April of 2011, it has historically been a signal of significant risk in the equity market. The preceding two instances were followed by the equity market losing roughly half its value over the following 24-36 months. Overall this setup represents a long-term headwind for the market. One limitation of this series is that it is reported on a lag. The chart shows data through August.
Joshua Steiner, CFA
Robert Belsky
Having trouble viewing the charts in this email? Please click the link at the bottom of the note to view in your browser.
