Key Takeaways
* The big divergence occurring presently is the credit outperformance of global US banks relative to the fear that normally accompanies rising risk in Europe.
* Bank swaps in China were significantly wider WoW.
*Sovereign CDS - Sovereign swaps moved in tandem with bank swaps around the world, widening across the board.
* Chinese steel prices fell 0.5% (18 yuan) to 3647 yuan/ton, breaking its two week streak.
* The 2-10 Spread compressed 9 bps WoW, its second consecutive week of tightening.
Financial Summary
Financial Risk Monitor Summary
• Short-term(WoW): Negative / 2 of 12 improved / 8 out of 12 worsened / 3 of 12 unchanged
• Intermediate-term(WoW): Positive / 10 of 12 improved / 1 out of 12 worsened / 2 of 12 unchanged
• Long-term(WoW): Positive / 7 of 12 improved / 2 out of 12 worsened / 4 of 12 unchanged

1. American Financial CDS - The big divergence occurring presently is the credit outperformance of global US banks relative to the fear that normally accompanies rising risk in Europe. The question remains whether this means that they are now less risky, or is there a catch-up trade to be made.
Widened the least/ tightened the most WoW: HIG, JPM, MMC
Widened the most WoW: MBI, GNW, LNC
Tightened the most WoW: HIG, MS, AIG
Widened the most MoM: WFC, JPM, MBI

2. European Financial CDS - There was widening across the board in European financials last week, with Spanish and Italian banks leading the charge higher. France saw 3 of of 4 French bank swaps widen.

3. Asian Financial CDS - Chinese banks saw significant swap widening in the latest week. Japanese and Indian banks were also wider, though by a smaller margin.

4. Sovereign CDS – European sovereign swaps widened last week. Interestingly, Germany saw the largest percentage deterioration at 15% followed by Ireland at 14.8%. Spanish and Italian sovereign swaps were wider by 19 and 27 bps, respectively.


5. High Yield (YTM) Monitor – High Yield rates rose 21.6 bps last week, ending the week at 6.81% versus 6.59% the prior week.

6. Leveraged Loan Index Monitor – The Leveraged Loan Index fell 4.0 points last week, ending at 1728.59.

7. TED Spread Monitor – The TED spread was flat last week, ending the week at 26.5 bps.

8. Journal of Commerce Commodity Price Index – The JOC index fell 0.4 points, ending the week at 5.16 versus 5.5 the prior week.

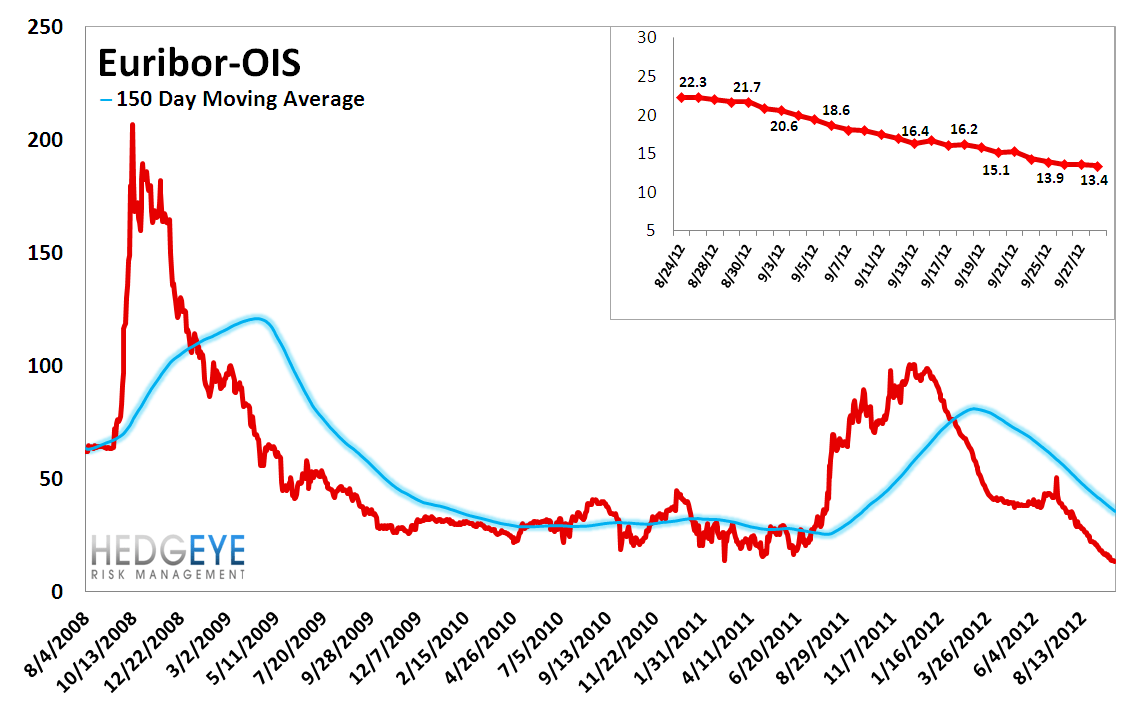
9. Euribor-OIS spread – The Euribor-OIS spread tightened by 2 bps to 13 bps. The Euribor-OIS spread (the difference between the euro interbank lending rate and overnight indexed swaps) measures bank counterparty risk in the Eurozone. The OIS is analogous to the effective Fed Funds rate in the United States. Banks lending at the OIS do not swap principal, so counterparty risk in the OIS is minimal. By contrast, the Euribor rate is the rate offered for unsecured interbank lending. Thus, the spread between the two isolates counterparty risk.
10. ECB Liquidity Recourse to the Deposit Facility – The ECB Liquidity Recourse to the Deposit Facility measures banks’ overnight deposits with the ECB. Taken in conjunction with excess reserves, the ECB deposit facility measures excess liquidity in the Euro banking system. An increase in this metric shows that banks are borrowing from the ECB. In other words, the deposit facility measures one element of the ECB response to the crisis.

11. Markit MCDX Index Monitor – Last week spreads widened 4 bps, leaving the MCDX at an index level of 136 bps versus 132 bps the prior week. The Markit MCDX is a measure of municipal credit default swaps. We believe this index is a useful indicator of pressure in state and local governments. Markit publishes index values daily on six 5-year tenor baskets including 50 reference entities each. Each basket includes a diversified pool of revenue and GO bonds from a broad array of states. We track the 16-V1.

12. Chinese Steel – Steel prices in China fell 0.5% last week, or 18 yuan/ton, to 3647 yuan/ton. Since the end of June, Chinese construction steel prices have fallen ~11%. This index is reflecting significant weakness in China's construction market. We use Chinese steel rebar prices to gauge Chinese construction activity, and, by extension, the health of the Chinese economy.

13. 2-10 Spread – We track the 2-10 spread as an indicator of bank margin pressure. Last week the 2-10 spread tightened to 140 bps, 9 bps tighter than a week ago.

14. XLF Macro Quantitative Setup – Our Macro team’s quantitative setup in the XLF shows 1.2% upside to TRADE resistance and 1.1% downside to TREND support.

Margin Debt - August: +0.73 standard deviations
NYSE Margin debt rose to $287 billion in August from $278 billion in July. We like to to look at margin debt levels as a broad contrarian sentiment indicator. For reference, our approach is to look at margin debt levels in standard deviation terms over the period 1. Our analysis finds that when margin debt gets to +1.5 standard deviations or greater, as it did in April of 2011, it has historically been a signal of significant risk in the equity market. The preceding two instances were followed by the equity market losing roughly half its value over the following 24-36 months. Overall this setup represents a long-term headwind for the market. One limitation of this series is that it is reported on a lag. The chart shows data through August.

Joshua Steiner, CFA
Robert Belsky
Having trouble viewing the charts in this email? Please click the link at the bottom of the note to view in your browser.