Seasonality Steals the Driver's Seat
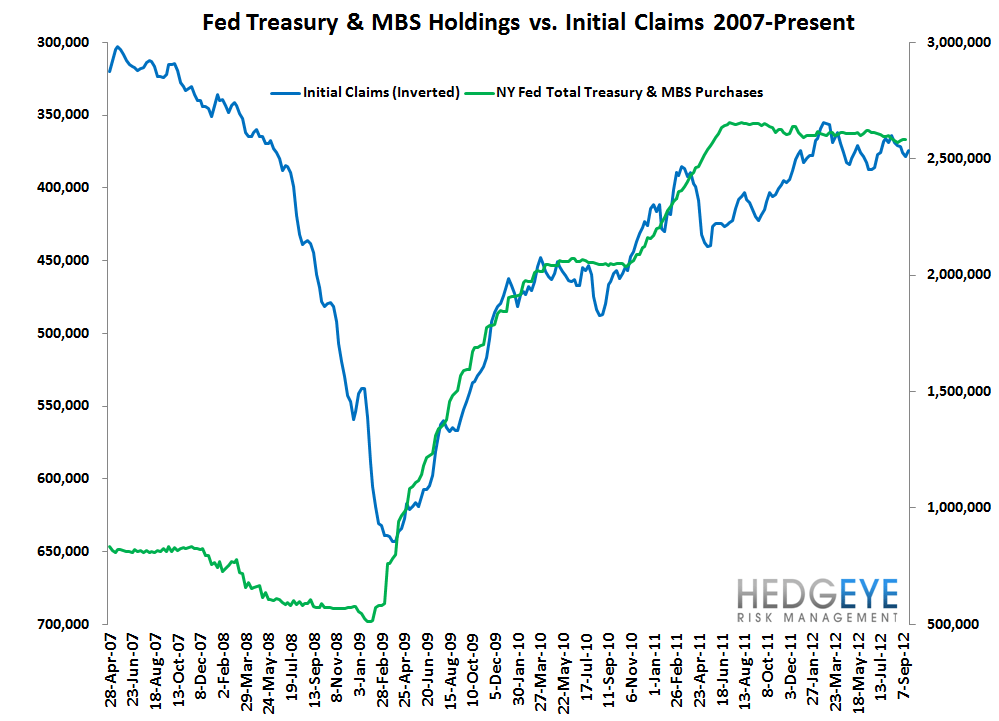
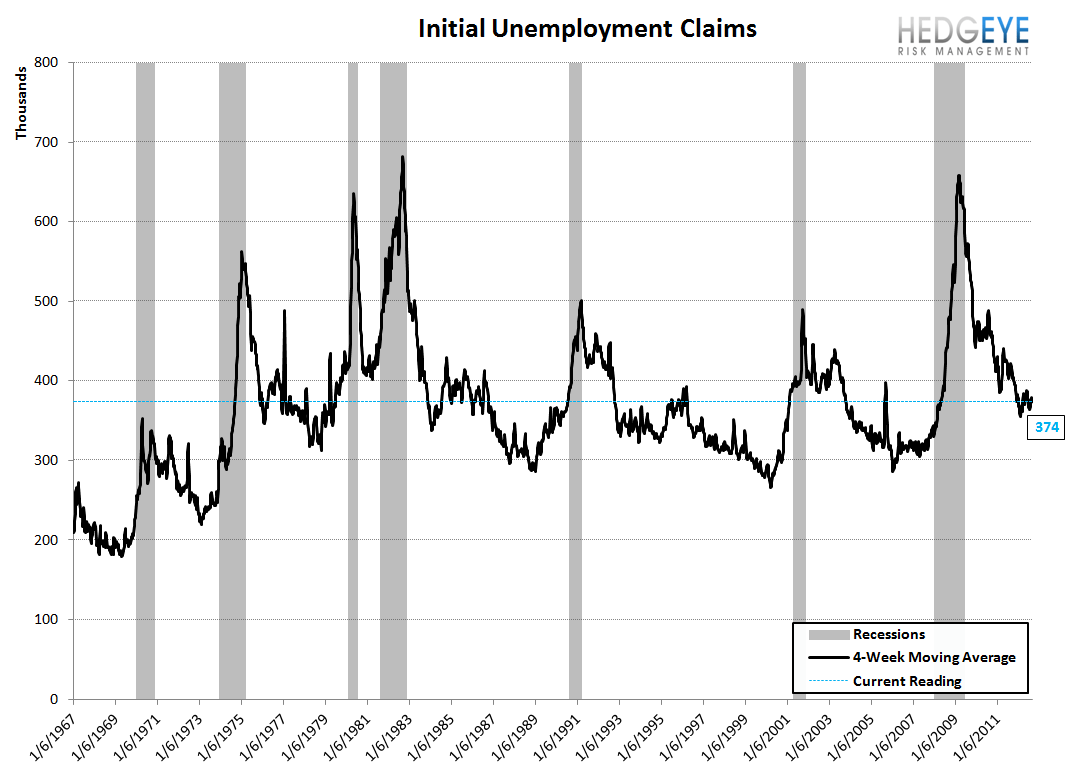
Initial jobless claims fell sharply last week, dropping 26k to 359k from 385k. This was well below consensus estimates for 375k. Rolling initial claims fell 4.5k to 374k. There are a couple possible explanations for the sharp drop. It's possible we're seeing the reversal of a temporary post-Isaac spike. It's also possible that there's a recurring week 38/39 distortion. Note that in 2011 a comparable decline occurred on the same week (there's a one-week mismatch due to the leap year). Regardless the cause, the bottom line is that this put claims back on a path of improvement, which we think is likely to be the dominant trend for the next five months, through February, 2013. We've harped on seasonality a lot, but to again reiterate, we think the two charts below speak for themselves. They illustrate quite plainly that in the last three years, ALL improvement in both initial jobless claims and nonfarm payrolls occurs in the September through February period while March through August stagnates or deteriorates. This seasonality distortion will again be present this year and next year.
So, the question is, aside from the seasonality issue, what's really going on? To answer that question, we look at the YoY trend in rolling non-seasonally adjusted claims. This week, that measure was down 7.9% vs. the same point last year. That compares with a decline of 7.9% in the prior week and 8.3% two periods earlier. Essentially, it's unchanged, which means that the trajectory of improvement is intact, for now.


Yield Spreads
The 2-10 spread compressed 13 bps WoW, driven by a 16 bps compression at the long end of the curve. QTD, the 2-10 spread is averaging 1.36%, which is down 15 basis vs 2Q12.


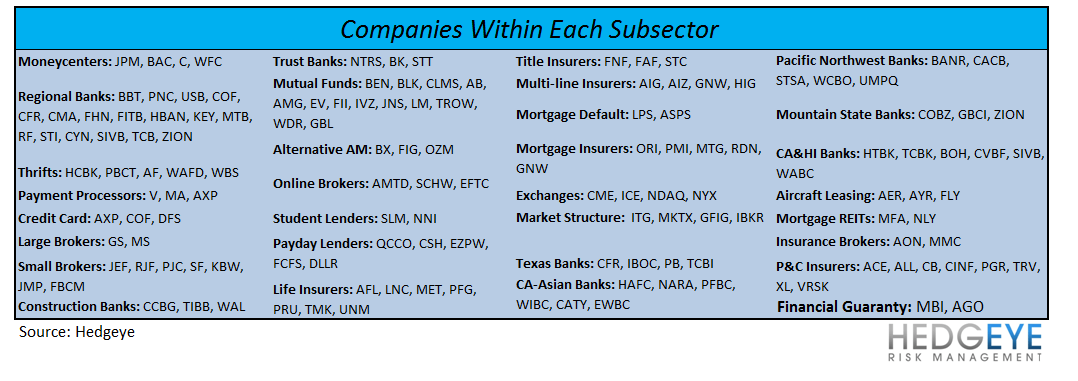
Financial Subsector Performance
The table below shows the stock performance of each Financial subsector over multiple durations.

Joshua Steiner, CFA
Robert Belsky
Having trouble viewing the charts in this email? Please click the link at the bottom of the note to view in your browser.
