Chart: Brent Crude and the US Dollar Index

09/26/12 02:36PM EDT

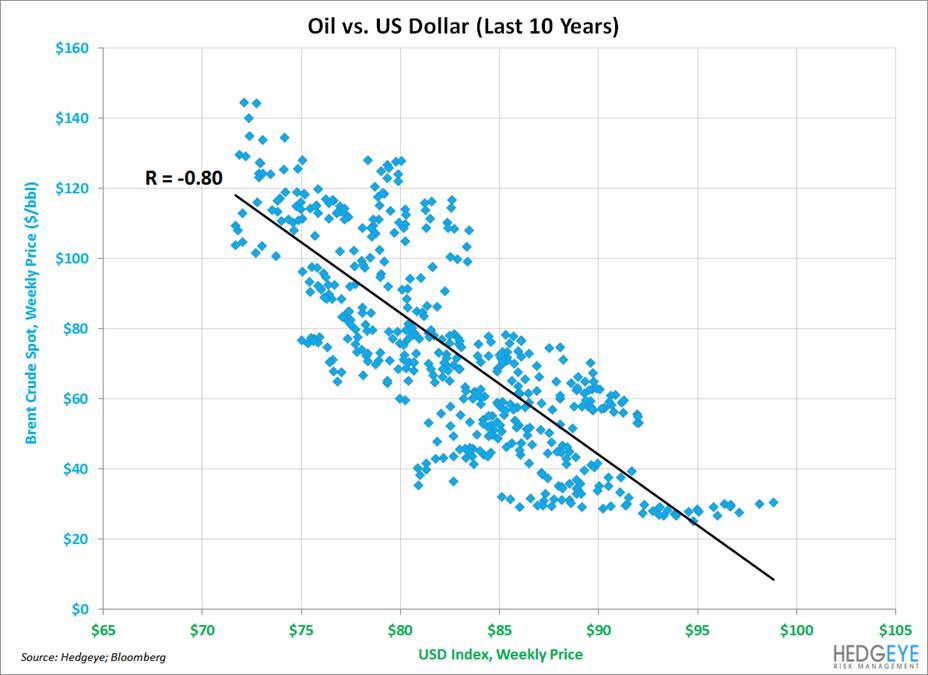
Below is a chart created by Hedgeye energy analyst Kevin Kaiser -- it shows the relationship between Brent oil prices and the US Dollar Index over  ten-year period. As you can see, Brent crude prices move essentially in the opposite direction of the US Dollar Index.  

That means that if the US Dollar strengthens, oil prices are likely to go lower. It's a very telling chart, and is consistent with Keith's adage: "If you get the US Dollar right, you get a lot of other things right."


Chart: Brent Crude and the US Dollar Index - brent

© 2024 Hedgeye Risk Management, LLC. The information contained herein is the property of Hedgeye, which reserves all rights thereto. Redistribution of any part of this information is prohibited without the express written consent of Hedgeye. Hedgeye is not responsible for any errors in or omissions to this information, or for any consequences that may result from the use of this information.