Key Takeaways
* Bank swaps domestically and in Europe saw significant widening WoW as economic uncertainty trumped monetary stimulus relief once again. Sovereign swaps followed suit mostly rising WoW. French, Italian, Spanish, and Portuguese sovereign swaps were all wider while Germany and Ireland saw their sovereign swaps tighten.
* In Asia, bank swaps were mixed. Chinese bank swaps tightened while Indian bank swaps widened.
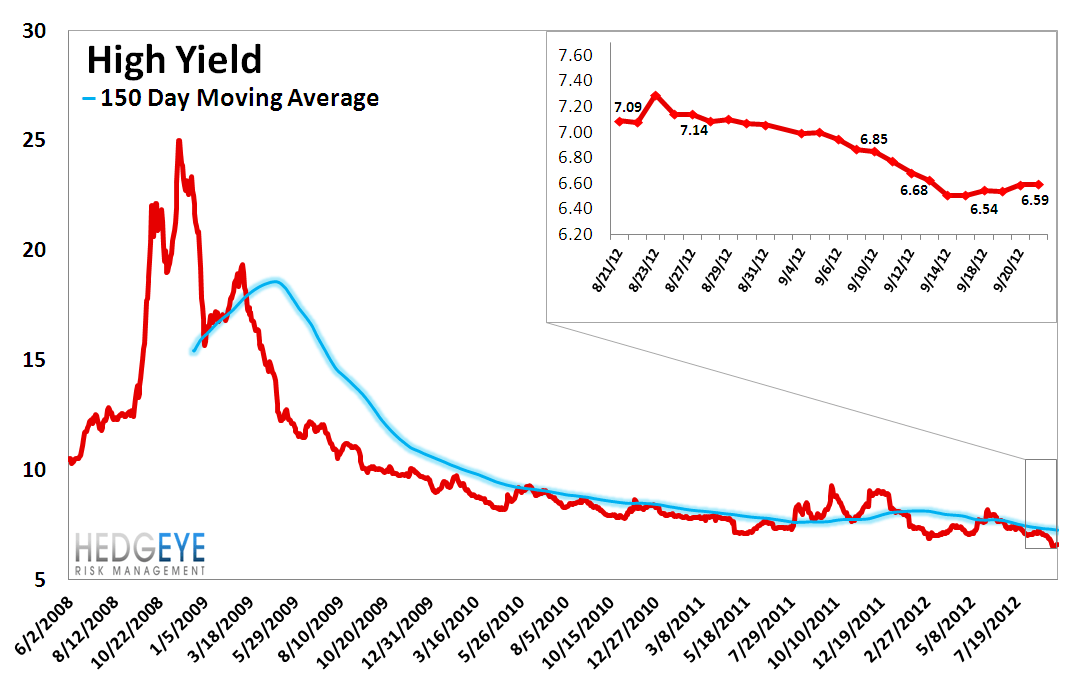
* High yield rates increased 8.8 bps last week, ending at 6.59 versus 6.51.
* The Euribor-OIS spread tightened by 1 bps to 15 bps, and is now back at its tightest levels in the last five years.
* The MCDX, our preferred measure of municipal default risk fell by 3.3% last week.
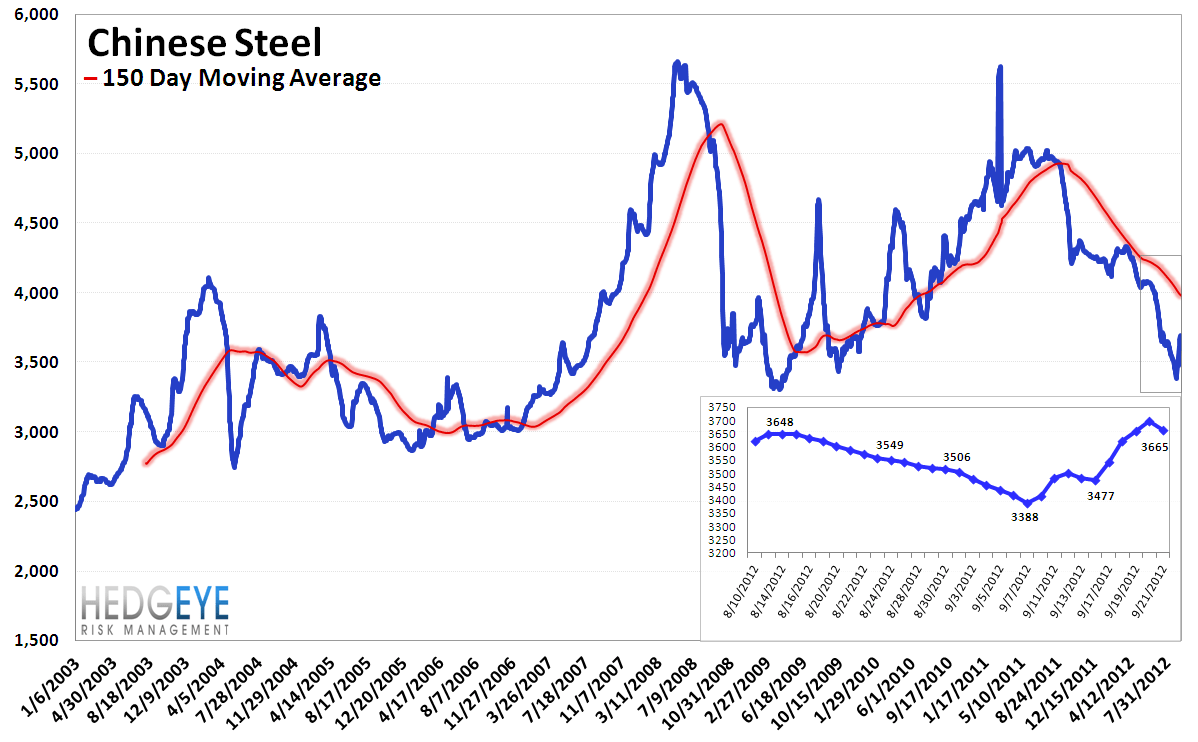
*Chinese steel prices rose a second consecutive week in a row, increasing by 5.4% WoW.
* The 2-10 spread tightened WoW, falling 12 bps. The brief reprieve following the Qe3 seems to be over.
* More risk than reward - Our Macro team’s quantitative setup in the XLF shows 0.6% upside to TRADE resistance and 2.7% downside to TREND support.
Financial Risk Monitor Summary
• Short-term(WoW): Positive / 6 of 12 improved / 4 out of 12 worsened / 3 of 12 unchanged
• Intermediate-term(WoW): Positive / 11 of 12 improved / 1 out of 12 worsened / 1 of 12 unchanged
• Long-term(WoW): Positive / 6 of 12 improved / 2 out of 12 worsened / 5 of 12 unchanged

1. American Financial CDS – The money center banks and large domestic brokers all saw swaps widen materially last week with the average reference entity seeing a +14.6% increase in swap prices WoW.
Widened the most WoW: WFC, JPM, BAC
Tightened the most WoW: MBI, UNM, AGO
Widened the most/ tightened the least MoM: JPM, WFC, AXP
Tightened the most WoW: GS, AIG, MS

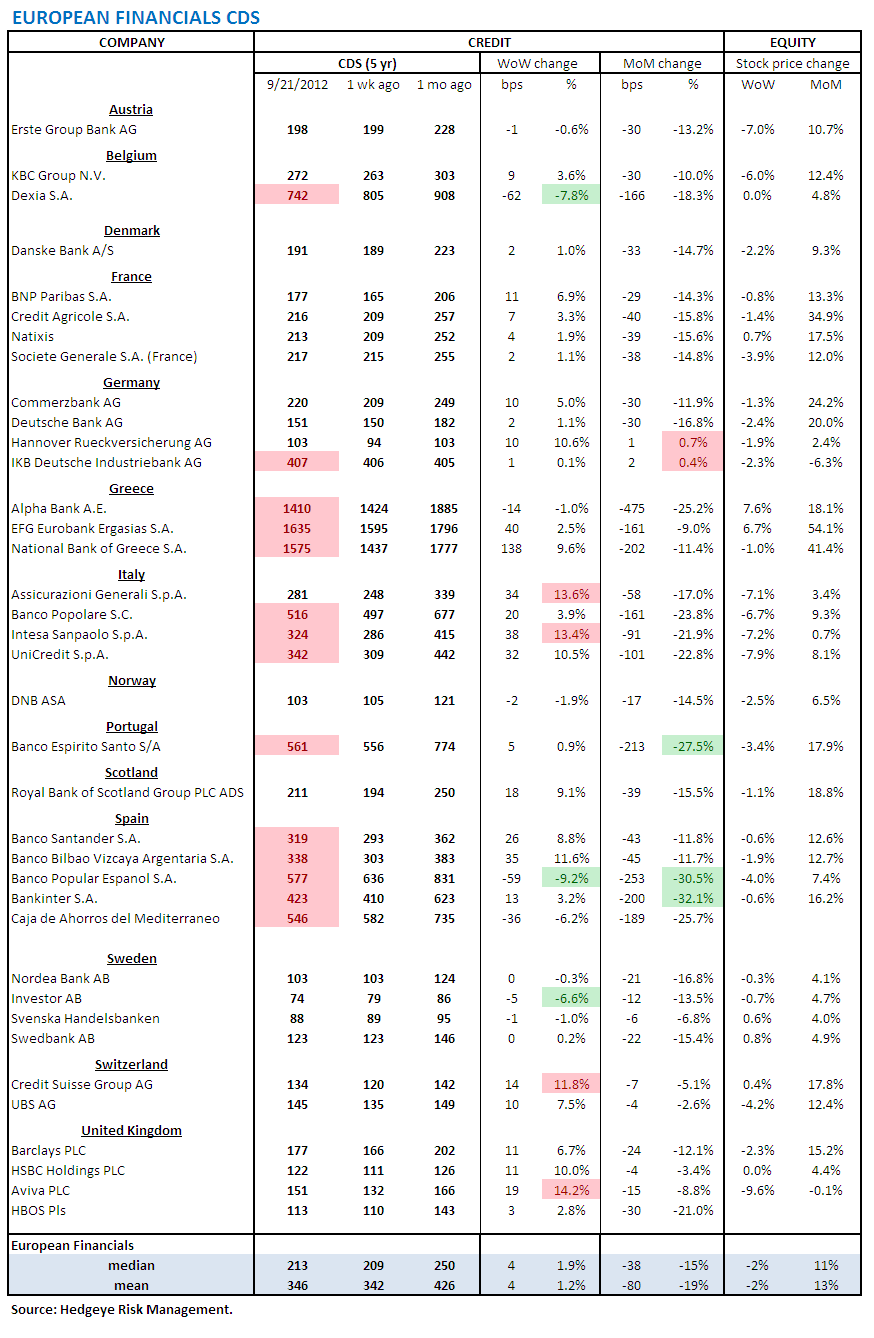
2. European Financial CDS – French, German, Italian, Spanish and UK bank swaps all widened last week.
3.Asian Financial CDS – Asian bank swaps were a mixed bag with Chinese banks tightening and Indian banks widening. Japanese banks were mixed.

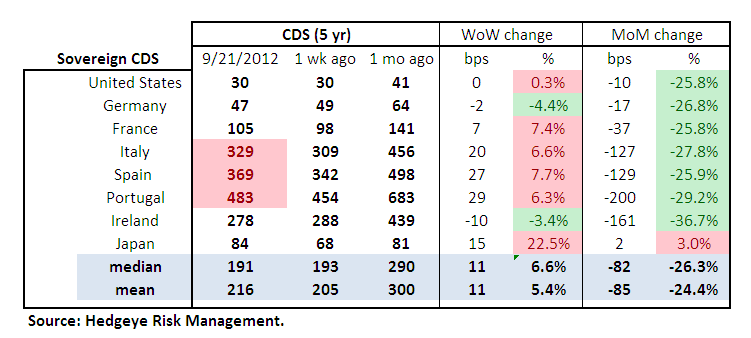
4. Sovereign CDS – European sovereign swaps were mostly wider last week with the exception of Germany and Ireland. Spanish, Italian and Portuguese swaps all widened between 20-30 bps last week.


5. High Yield (YTM) Monitor – High Yield rates rose 9 bps last week, ending the week at 6.59% versus 6.50% the prior week.
6. Leveraged Loan Index Monitor – The Leveraged Loan Index rose 4.6 points last week, ending at 1732.61.

7. TED Spread Monitor – The TED spread fell 2 bps points last week, ending the week at 26.5 bps.

8. Journal of Commerce Commodity Price Index – The JOC index rose 0.2 points, ending the week at 5.51 versus 5.3 the prior week.

9. Euribor-OIS spread – The Euribor-OIS spread tightened by 1 bps to 15 bps, and is now back at its tightest levels in the last five years. The Euribor-OIS spread (the difference between the euro interbank lending rate and overnight indexed swaps) measures bank counterparty risk in the Eurozone. The OIS is analogous to the effective Fed Funds rate in the United States. Banks lending at the OIS do not swap principal, so counterparty risk in the OIS is minimal. By contrast, the Euribor rate is the rate offered for unsecured interbank lending. Thus, the spread between the two isolates counterparty risk.

10. ECB Liquidity Recourse to the Deposit Facility – The ECB Liquidity Recourse to the Deposit Facility measures banks’ overnight deposits with the ECB. Taken in conjunction with excess reserves, the ECB deposit facility measures excess liquidity in the Euro banking system. An increase in this metric shows that banks are borrowing from the ECB. In other words, the deposit facility measures one element of the ECB response to the crisis.

11. Markit MCDX Index Monitor – Last week spreads tightened 5 bps, ending the week at 132 bps. The Markit MCDX is a measure of municipal credit default swaps. We believe this index is a useful indicator of pressure in state and local governments. Markit publishes index values daily on six 5-year tenor baskets including 50 reference entities each. Each basket includes a diversified pool of revenue and GO bonds from a broad array of states. We track the 16-V1.

12. Chinese Steel - Steel prices in China rose 5.4% last week, or 188 yuan/ton, to 3665 yuan/ton. This brings the two-week rally to ~8%. However, taking a step back, in the last three months, Chinese construction steel prices have fallen ~10% inclusive of this recent rally. This index is reflecting significant weakness in China's construction market. Chinese steel rebar prices have been generally moving lower since August of last year. We use Chinese steel rebar prices to gauge Chinese construction activity, and, by extension, the health of the Chinese economy.
13. 2-10 Spread – We track the 2-10 spread as an indicator of bank margin pressure. Last week the 2-10 spread tightened by 12 bps to 149 bps.

14. XLF Macro Quantitative Setup – Our Macro team’s quantitative setup in the XLF shows 0.6% upside to TRADE resistance and 2.7% downside to TREND support.

Margin Debt - July: +0.61 standard deviations
NYSE Margin debt fell to $278 billion in July from $285 billion in June. We like to to look at margin debt levels as a broad contrarian sentiment indicator. For reference, our approach is to look at margin debt levels in standard deviation terms over the period 1. Our analysis finds that when margin debt gets to +1.5 standard deviations or greater, as it did in April of 2011, it has historically been a signal of significant risk in the equity market. The preceding two instances were followed by the equity market losing roughly half its value over the following 24-36 months. Overall this setup represents a long-term headwind for the market. One limitation of this series is that it is reported on a lag. The chart shows data through July.

Joshua Steiner, CFA
Robert Belsky
Having trouble viewing the charts in this email? Please click the link at the bottom of the note to view in your browser.
