Treading Water
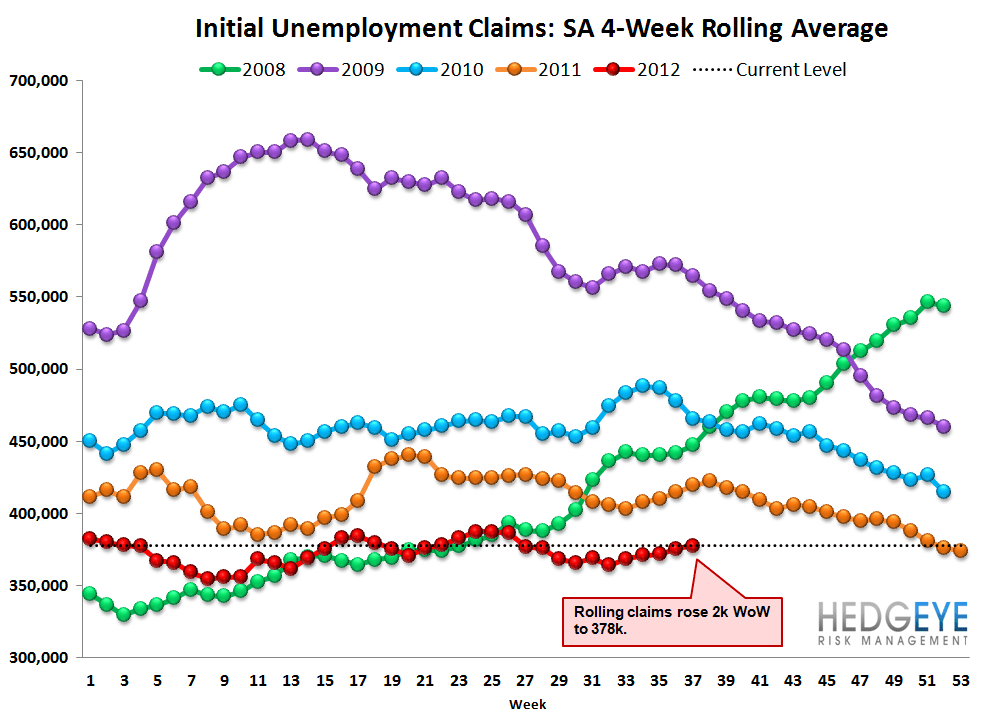
Initial claims were flat last week at 382k (but fell 3k after a 3k upward revision to the prior week's data). Rolling claims rose 2k WoW to 378k and non-seasonally adjusted claims rose 28k to 328k.
Our preferred method of looking at the data is to look at the year over year change in the rolling non-seasonally adjusted series because it eliminates the distortion of bad seasonality adjustments. The rolling NSA data declined 7.9% YoY, which compares against -8.3% in the prior week. We would expect to see this improvement steadily converge toward zero, but second derivative inflections are notable. This week's inflection was negative, on the margin.
Frothy
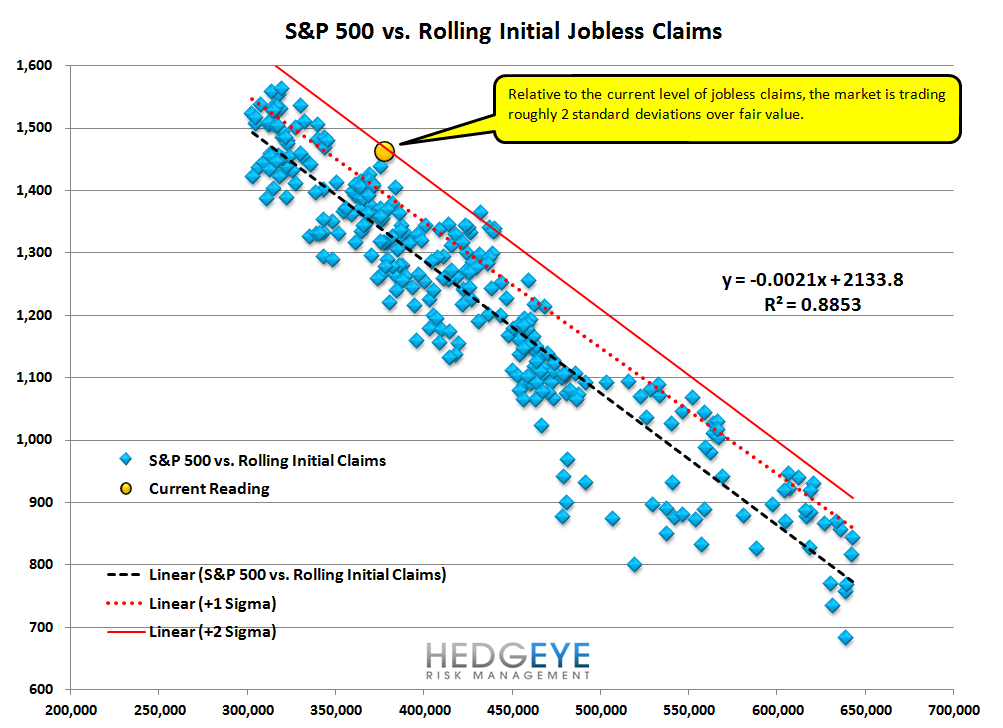
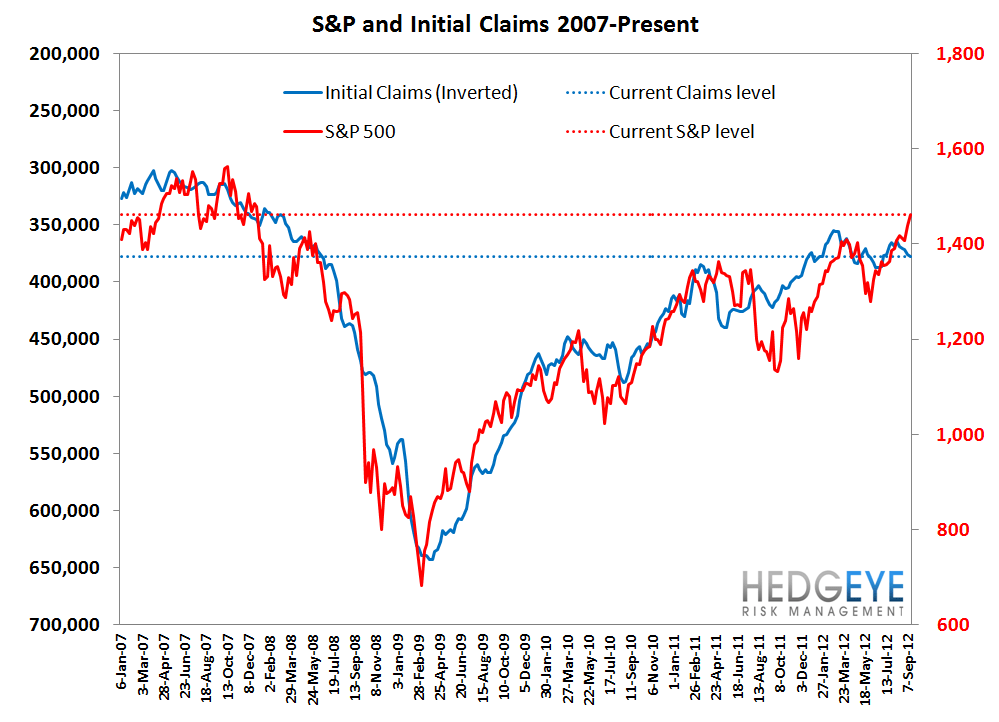
Another takeaway this week is the widening divergence between the S&P 500 and the rolling claims series. We profile this in the chart below entitled "S&P 500 vs. Rolling Initial Jobless Claims". These two series are cointegrated, meaning that they random walk (diverge) over short time frames but tether to each other over longer time periods. For reference, the current level of claims implies an S&P level of ~1339, which is roughly 8% lower than the current S&P level of 1461. What the chart shows is that the market is currently two standard deviations above fair value, which, based on history, is unsustainable.


Yield Spreads
The 2-10 spread fell 1 bp week-over-week to 150 bps as the 10 year treasury yield rose 1 bp and the 2-year treasury rose 2 bps. QTD, the 2-10 spread is averaging 1.36%, which is 15 bps lower than 2Q12.


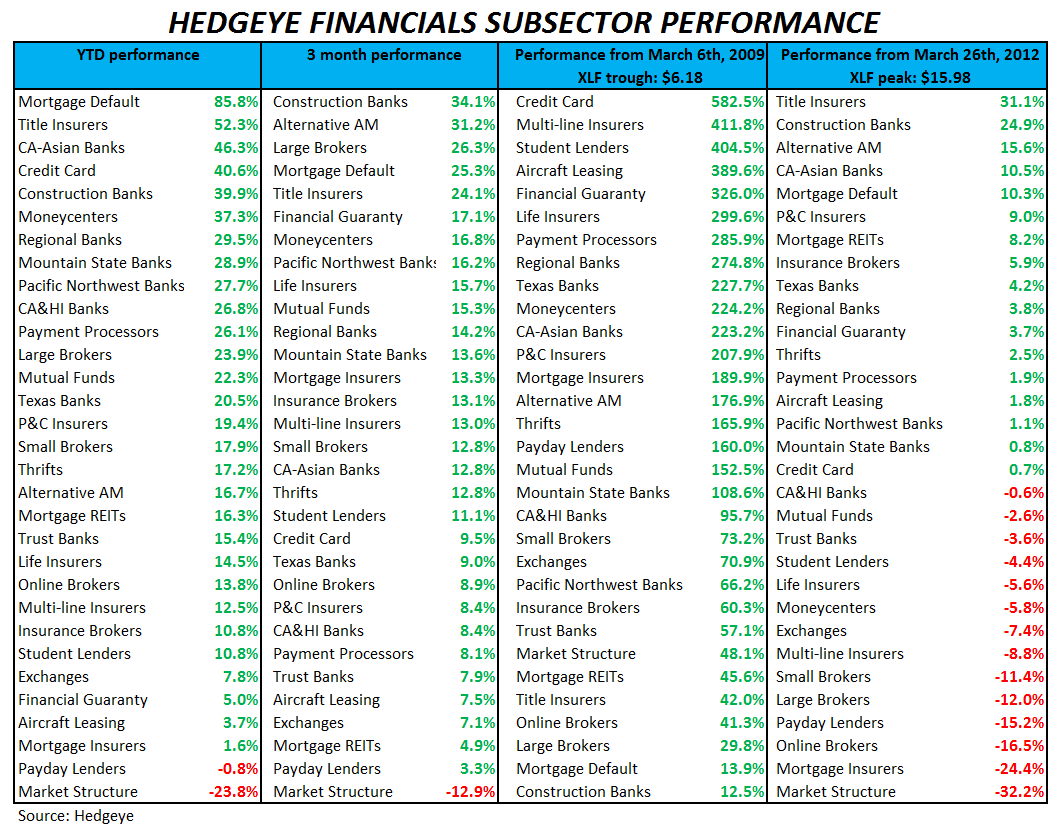
Financial Subsector Performance
The table below shows the stock performance of each Financial subsector over multiple durations.

Joshua Steiner, CFA
Robert Belsky
Having trouble viewing the charts in this email? Please click the link at the bottom of the note to view in your browser.
