This note was originally published at 8am on September 04, 2012 for Hedgeye subscribers.
“And so he urged his countrymen: No more.”
-Hampton Sides (Blood and Thunder)
That’s what the head of the Navajo warriors, Manuelito, said to his people before ultimately succumbing to General Sherman’s troops. Maybe we’re going down versus the Fed’s Bailout Beggars too, but it won’t be without one heck of a fight.
Last week ended with a Draghi bagging the Jackson Hole meeting and Ben Bernanke doing nothing that resembled what he was allegedly going to do only 2 weeks prior. Rumor versus reality is a widening spread.
“What is the truth (Ray Dalio)?” Stocks continue to make lower-highs as bonds continue to make higher-lows. I urge all of you to join me in calling for No More of what has not worked. Otherwise, you’ll have $130-150 Oil and 1970s stagflation all over again.
Back to the Global Macro Grind…
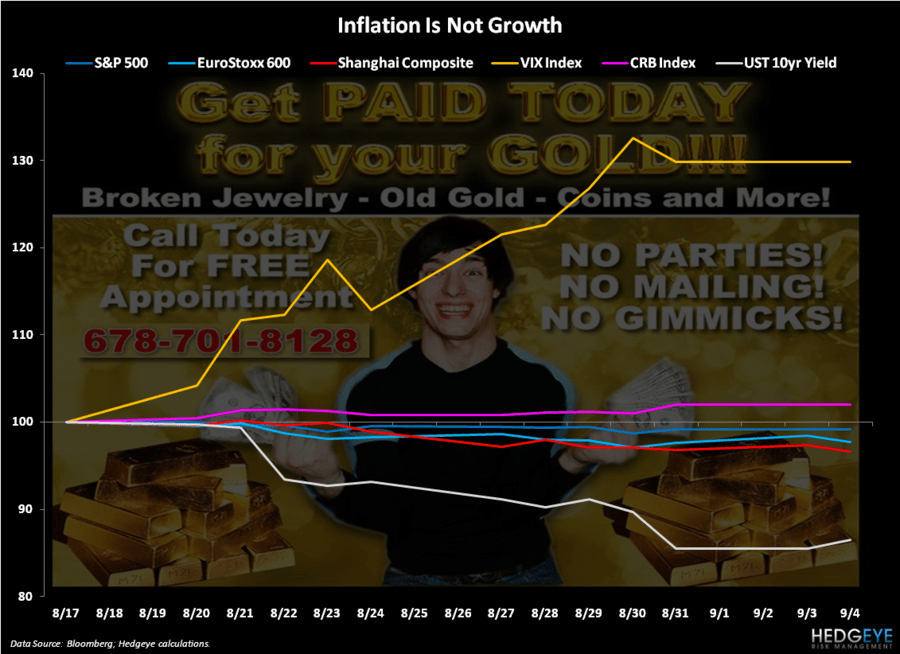
Both US and Global Equities were down again last week (2 consecutive down weeks for the SP500, 1 month lows for Asia). Both Treasury Bonds and Commodities were up. The latter perpetuates #GrowthSlowing expectations in the former.
But no worries. Everyone who drives to work, eats food, and sends their kids to school this week understands the very basic P&L problem associated with cost of living rising as nominal wages are falling:
- American median incomes = down -5% since 2009
- US Dollar = down -5% since January 20, 2009
- Oil (WTIC) = +150% since January 20, 2009
Almost everyone, that is…
Mostly everyone else understands the concept of long-term lower-highs (stocks) and higher-lows (bonds) as well. Here’s what’s happened in the last 2 weeks as we setup for risk managing September:
- US Stocks (SP500) = down -0.85% (from 1418) to 1406 on Friday
- European Stocks (Eurostoxx600) = down -1.8% (from 272) to 267 this morning
- Chinese Stocks (Shanghai Comp) = down -3.5% (from 2118) to 2043 this morning
All the while:
- US Equity Volatility (VIX) = up +30% from its YTD closing low (2wks ago)
- Commodities (CRB Index) = up +1.9% (from 303) to 309 this morning
- US Treasury Yields (10yr) = down -14% (from 1.81%) to 1.55% this morning
So, who on God’s good earth profits from this economic model? If you bought bonds, volatility, and commodities 2 weeks ago, you did. But what % is that of the global population? Did higher prices in those 3 things perpetuate economic growth, or slow it?
If you bought Gold 2 weeks ago (we didn’t because we didn’t think Bernanke would go to Qe4 – and he didn’t), that’s up +4.8%. Great trade! But what does that mean? It means that the purchasing power of US Dollars continues to be debauched.
Are institutional investors long Gold? You bet your Madoff they are – and with headlines dominating your every day like this: “Gold, Near 5mth High, Seen Gaining on Prospects for More Stimulus” (Bloomberg), why shouldn’t they be?
Weekly CFTC data implies Gold buyers ramped bets on Bernanke right back up to where they were before they started falling in March (+19% wk-over-wk to almost 132,000 contracts).
Those are called expectations. Instead of jobs and economic growth, that’s what Bernanke really stimulates and, in doing so, perpetuates the US growth slow-down via commodity inflation.
This is why our Global Macro Model continues to nail #GrowthSlowing calls at these shortened economic cycle turns well ahead of consensus. Our models adjust, real-time, for Dollar Debauchery and Oil Inflation.
How long can inflation of market prices be masked as “economic growth”? Not for long. Each and every one of these Qe experiments gives markets shorter-term pops and more volatile reversals.
So, if you bought Gold (or Commodities) at the month-end markup of February 2012, or if you bought it there at lower-highs on Friday, the probability just went straight up (like the asset price did) that they will now come down again.
That’s called Deflating The Inflation. And while Bernanke wants you to believe that you’ll have no more of that (maybe ever), I’ll repeat what we all can’t afford any more of – policies to inflate asset prices that, in turn, slow growth.
My immediate-term support and resistance ranges for Gold, Oil (Brent), US Dollar, EUR/USD, 10yr UST Yield, and the SP500 are now $1665-1696, $113.69-116.57, $81.11-81.91, $1.24-1.26, 1.55-1.64%, and 1399-1417, respectively.
Best of luck out there this week,
KM
Keith R. McCullough
Chief Executive Officer