“I wouldn’t be doing my job if I started thinking that way.”
-Neil Barofsky
In one of the more riveting introductions to a book I have read in some time (Bailout – “An Inside Account of how Washington Abandoned Main Street While Rescuing Wall Street”), that’s what former Special Inspector General for TARP, Neil Barofsky, told former Assistant Secretary of the Treasury for Financial Stability, Herb Allison.
Herb was one of Hank Paulson and Timmy Geithner’s guys. He was also the former CEO of Fannie Mae and President of Merrill Lynch. While objectively analyzing the biggest taxpayer bailout in US history, Allison told Barofsky “you’re really hurting yourself” and asked him “have you thought at all about what you’ll be doing next?”
Evidently Barofsky had thought about it. He decided to tell the truth. Meanwhile, as we test 4.5 year highs, memories are short and storytelling is back. I, for one, haven’t forgotten the lessons of 2007-2008. The truth is, neither should you.
Back to the Global Macro Grind…
After 3 weeks down, US stocks had 2 up days, then a down day. After 4 months down, Chinese stocks had 3 up days, then a down day. What is the truth? With the price of Oil up +31% since late June, is economic growth going to magically appear?
To Review:
- Dollar Down inflates asset prices (stocks and commodities) in the short-term
- Rising Inflation Expectations slow real (inflation adjusted) economic growth in the long-term
- As Growth Slows, begging for bailouts (and more Dollar Debauchery) is what Old Wall Street does
This is not new. In fact, what’s quite sad about it at this stage of the game is that everyone knows precisely how it works. How else would you explain the following?
- CFTC bullish futures and options contracts testing all-time highs (1.33 million contracts) as demand slows
- Gold speculative contracts up +35% and +10% wk-over-wk in the last 2 weeks, respectively (pre Fed meeting)
- Again, Oil prices up +31% in a straight line (bull contracts pushing 200,000) since mid-June as global growth has slowed
And, again… these are just questions. I wouldn’t be doing my job if I didn’t ask them that way.
Another risk management question about the current #BailoutBull rally in stocks and commodities is how does this all end? One of the easiest ways to answer that question is reversing what’s driven asset prices higher (Dollar Down). What happens when the Fed runs out of communication ammo and the largest Ball Under Water trade (Dollar Up) in US history rips to the upside again?
Sadly, at this point, Obama, Geithner, and Bernanke know the answer to that question just as well as Vladimir Putin does. President Bush understood it too. We call it the Correlation Risk. Central planners don’t call it anything because that would be an admission of the most obvious risk in the world right now. It would also make them accountable for it.
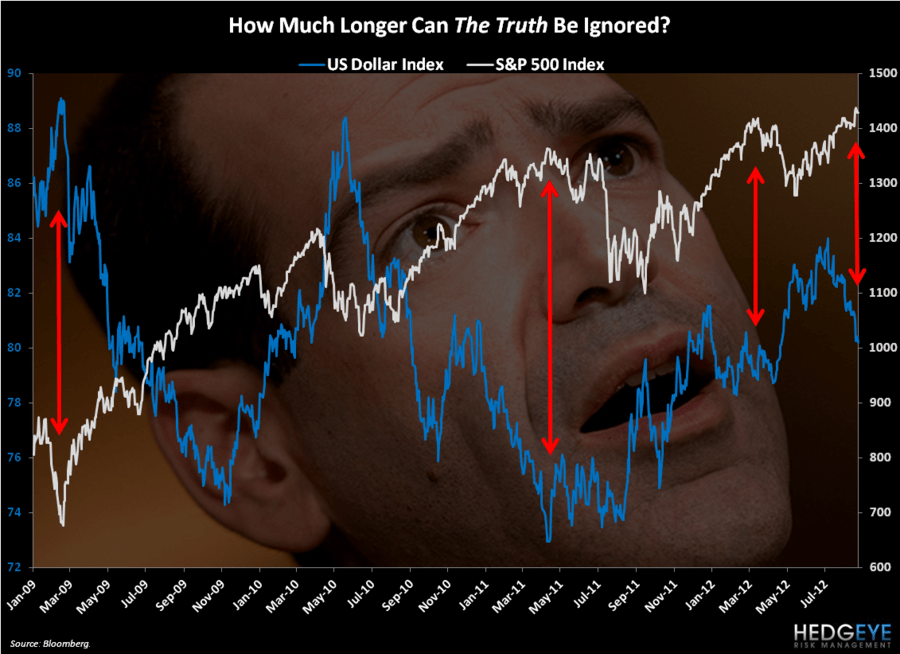
Here’s the update on that (Correlation Risk between the US Dollar and everything else on our immediate-term TRADE duration):
- Gold -0.92
- Silver -0.88
- Copper -0.89
- CRB Index -0.89
- SP500 -0.73
- Eurostoxx600 -0.77
In other words, with the US Dollar on 3-month lows, mostly everything Big Macro that moves on no-volume these days has gone straight back up to lower long-term highs. All the while, the US Dollar continues to make higher long-term lows (see chart).
As a result, the next calamity in stocks and commodities will be no different than the one we just saw from the March highs to the June lows. Every one of these centrally planned debaucheries of the currency ignites shorter-term rallies and steeper corrections.
It also perpetuates structural long-term growth slowing, globally. And why the Fed can’t figure out the why on that is very simple – they haven’t run real-time businesses that have to meet payrolls. Therefore, they don’t get expectations.
Thinking That Way, for anyone who hasn’t spent their entire life getting paid by the largesse of the US Government’s broken policy promises, isn’t tyrannical. It’s just common sense.
My immediate-term support and resistance risk range for Gold, Oil (Brent), US Dollar, EUR/USD, 10yr US Treasury Yield, Russell2000, and the SP500 are now $1, $113.47-115.48, $80.11-81.21, $1.24-1.28, 1.56-1.67%, 823-846, and 1, respectively.
Best of luck out there today,
KM
Keith R. McCullough
Chief Executive Officer