Big Picture - Where Are We With Respect to Employment?
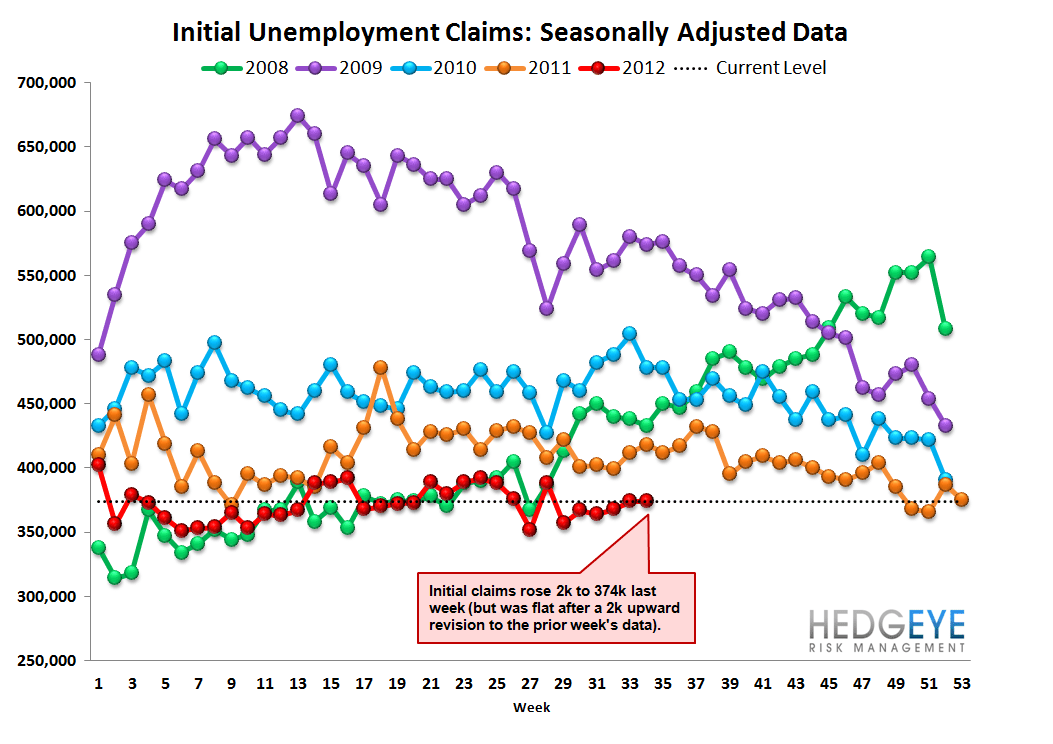
The good news: jobless claims are still below the threshold level of 385-400k that we've identified as the break even point for the unemployment rate. Below that threshold, the unemployment rate falls and vice versa. Also, on a year-over-year basis, rolling non-seasonally-adjusted jobless claims are still improving, down 7.8% YoY this past week. These two reference points suggest that the health of the labor market is intact. Further, we are on the cusp of the seasonal adjustment factor headwind becoming a tailwind. Recall that the Lehman-based distortion reaches its maximum headwind in August/early September, and begins to unwind thereafter, reaching its peak tailwind by late February.
The bad news: the year-over-year change in the rolling NSA series compressed this past week to 7.8% improvement, down from 8.0% improvement in the prior week. More importantly, this measure is slowly but steadily converging toward zero suggesting the economic recovery is running out of steam. Also, the current disequilibrium between rolling SA claims and the S&P 500 suggests fair value on the market of 1,352, or roughly 4% lower than where it's trading presently.
The Numbers
Initial jobless claims rose 2k to 374k last week, but were flat after a 2k upward revision to the prior week's data. Rolling claims rose 1.5k WoW to 370k.


Yield Spreads - More Margin Pressure
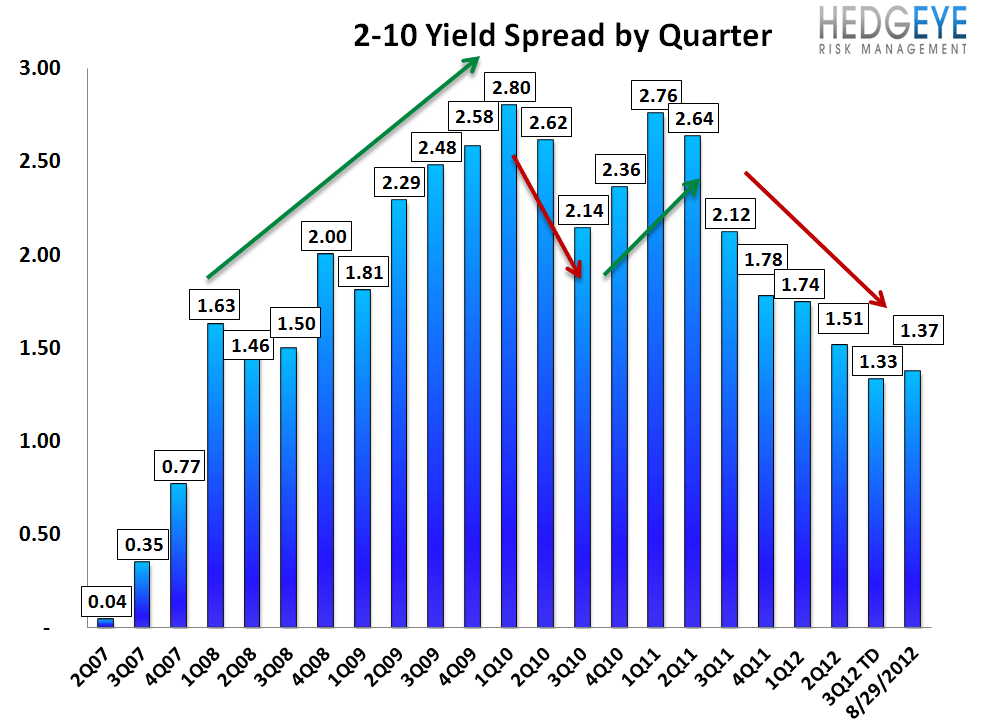
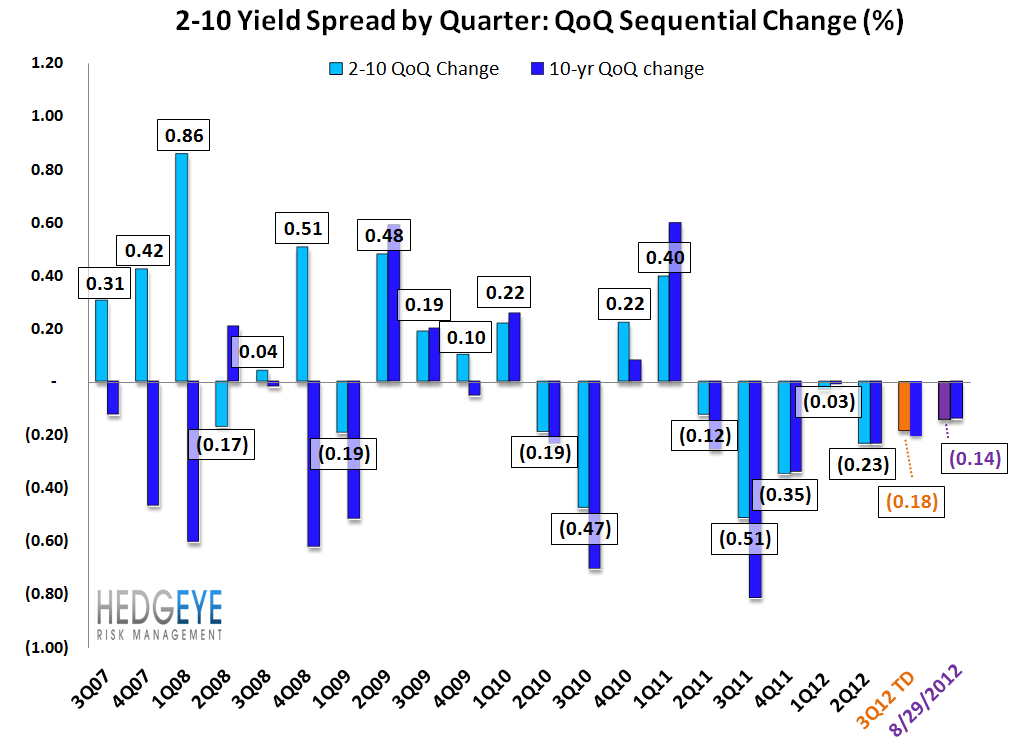
The yield spread compressed last week by 5 bps, pushing the 2-10 spread to 137 bps from 142 bps the week prior. Ten year yields fell 4 bps to 165 bps from 169 bps. Currently, the 3Q12 yield spread is down 18 bps QoQ thus far in the third quarter.
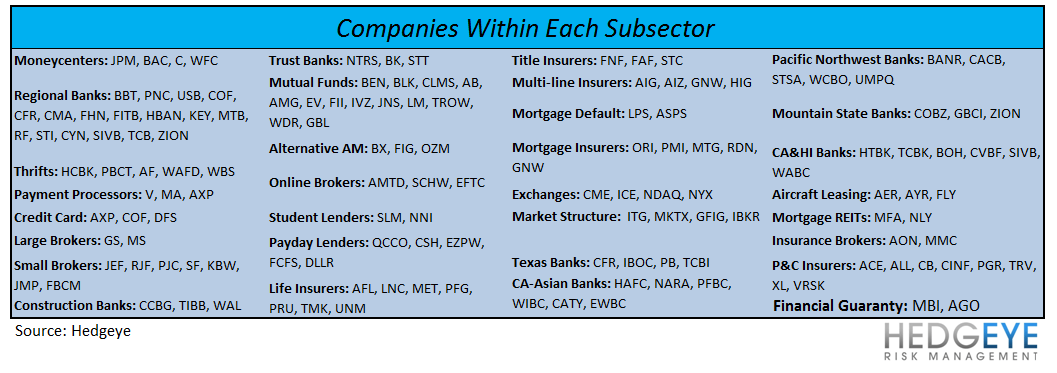
Financial Subsector Performance
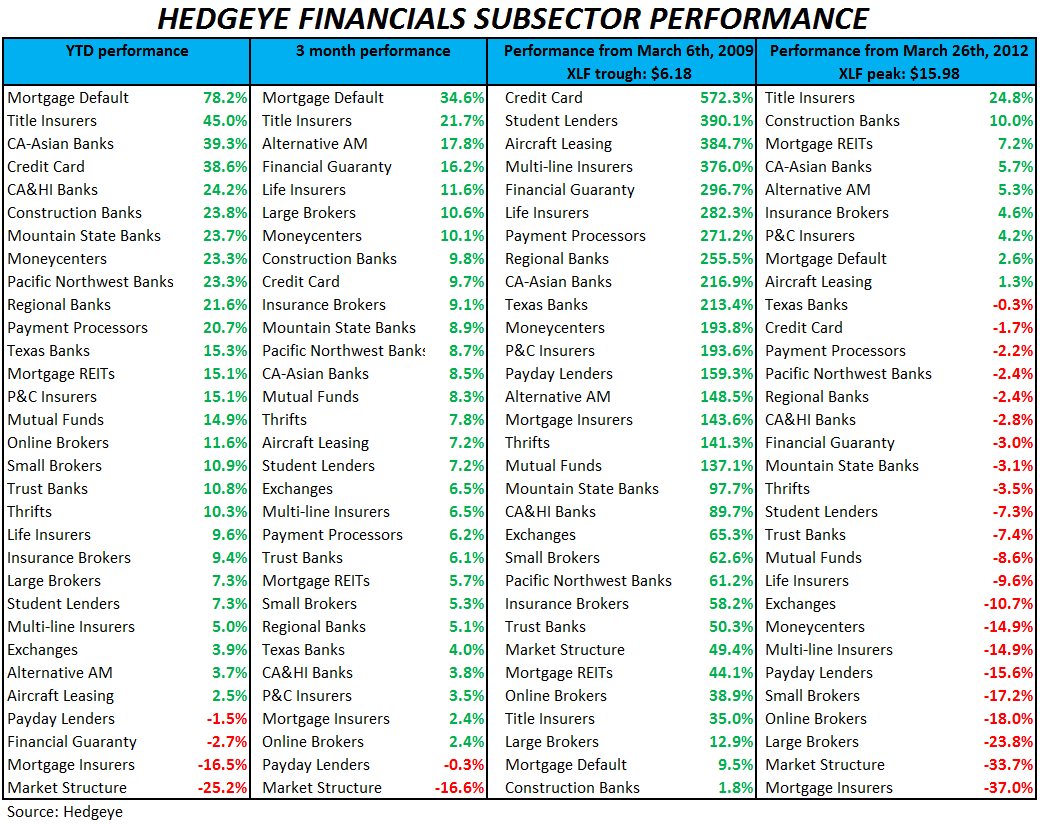
The table below shows the stock performance of each financial subsector over multiple durations.
Joshua Steiner, CFA
Robert Belsky
Having trouble viewing the charts in this email? Please click the link at the bottom of the note to view in your browser.
