* The U.S. financials rallied further last week, but in much more subdued fashion with the XLF up 0.4%. The XLF remains the only sector still broken from a TREND standpoint (intermediate term) on our macro team's quantitative setup.
* European financials acted a lot like European sovereigns, both tightening week over week. The Draghi rally continues for now.
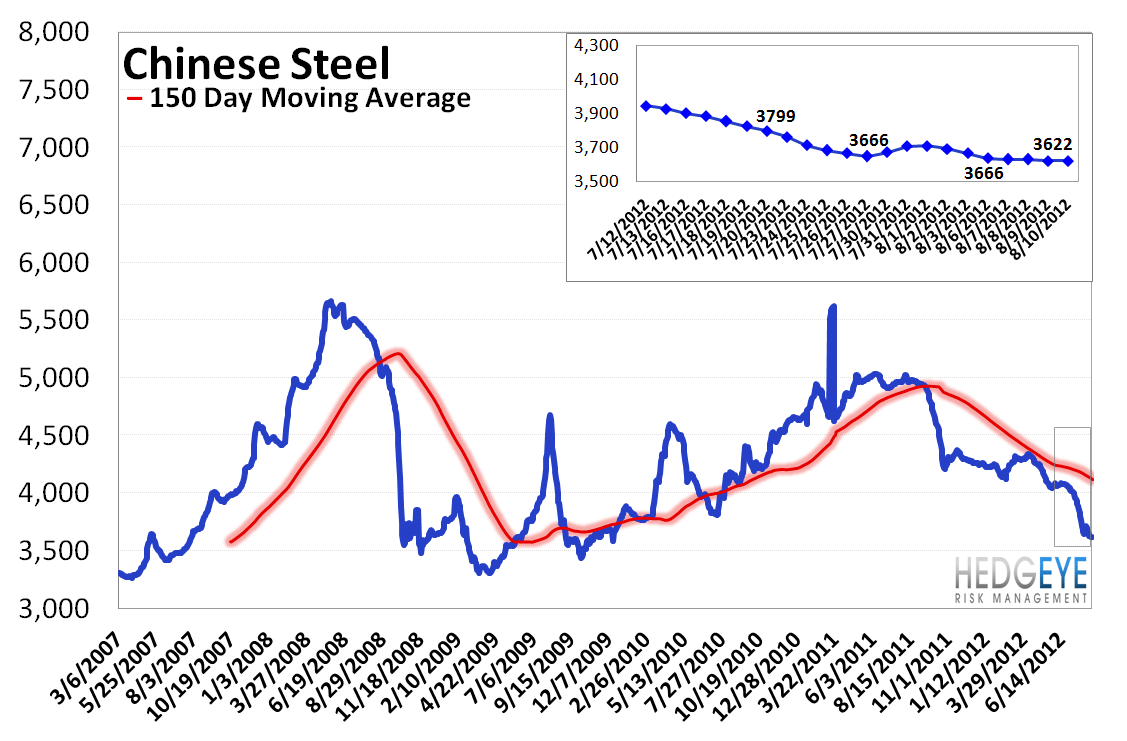
* Meanwhile, on the other side of Earth, steel prices in China fell another 1.2% last week, or 44 yuan/ton, to 3,622 yuan/ton. In the last few months, Chinese construction steel prices have fallen ~10%. This index is reflecting significant weakness in China's construction market.
* Last week the 2-10 spread widened 8 bps last week to 140 bps, and is now up more than 20 bps from its late July lows. After the battering net interest margins took in 2Q, this is a positive development, on the margin. That said, the 2-10 spread averaged 151 bps in 2Q12, so even with the rally of the last few weeks it is still trending down 20 bps QoQ thus far in 3Q.
* Our Macro team’s quantitative setup in the XLF shows 0.7% upside to TREND resistance of $14.90 and 0.9% downside to TRADE support of $14.57.
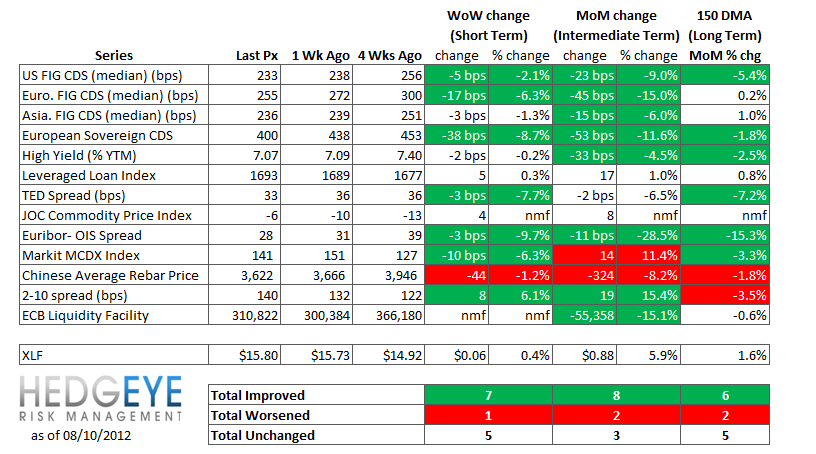
Financial Risk Monitor Summary
• Short-term(WoW): Positive / 7 of 12 improved / 1 out of 12 worsened / 5 of 12 unchanged
• Intermediate-term(WoW): Positive / 8 of 12 improved / 2 out of 12 worsened / 3 of 12 unchanged
• Long-term(WoW): Positive / 6 of 12 improved / 2 out of 12 worsened / 5 of 12 unchanged
1. US Financials CDS Monitor – Credit default swaps across U.S. financials were tighter week over week. Overall, 25 out 27 reference entities that we track saw credit default swaps tighten last week.
Tightened the most WoW: MTG, RDN, LNC
Widened the most/ tightened the least WoW: GS, UNM, MBI
Tightened the most MoM: MMC, AIG, ALL
Widened the most MoM: GNW, UNM, MTG

2. European Financial CDS - French and Italian banks tightened, alongside the sovereigns. Spanish banks were mixed, with a few of them posting sizable widening. Overall, however, swaps throughout Europe's financial system were notably tighter.

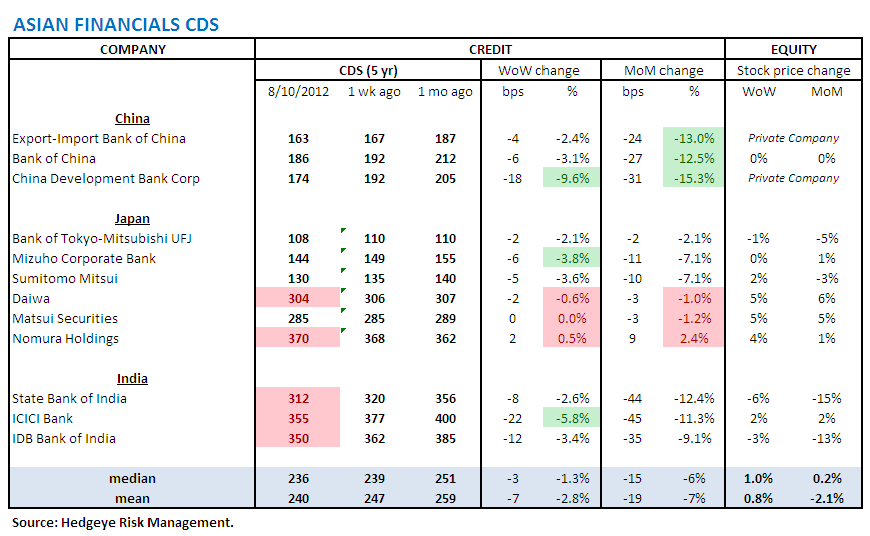
3. Asian Financial CDS - 10 of 12 reference entities we track across Asia had tighter credit default swaps week over week.
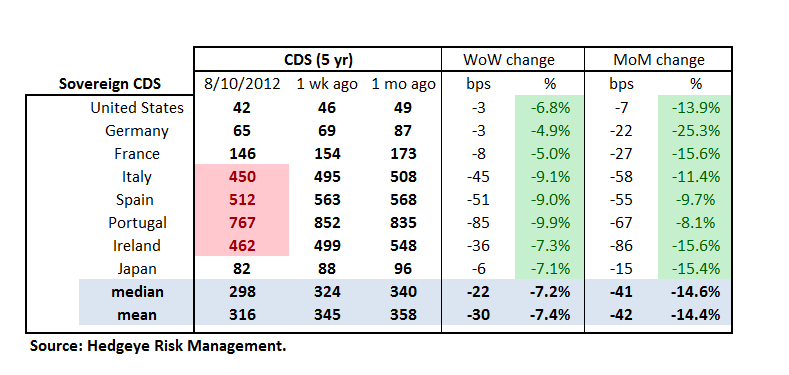
4. Sovereign CDS – Sovereign swaps were tighter around the globe last week. Portugal, Spain and Italy all saw their sovereign swaps tighten by more than 9%.


5. High Yield (YTM) Monitor – High Yield continues to tighten, as rates fell another 2 bps last week, ending the week at 7.07% versus 7.09% the prior week.

6. Leveraged Loan Index Monitor – The Leveraged Loan Index rose 4.6 points last week, ending at 1693.

7. TED Spread Monitor – The TED spread fell 3 bps last week, ending the week at 33.3 bps this week versus last week’s print of 36.08.

8. Journal of Commerce Commodity Price Index – The JOC index rose 4.2 points, ending the week at -5.59 versus -9.8 the prior week.

9. Euribor-OIS spread – The Euribor-OIS spread tightened by 3 bps to 28 bps. The Euribor-OIS spread (the difference between the euro interbank lending rate and overnight indexed swaps) measures bank counterparty risk in the Eurozone. The OIS is analogous to the effective Fed Funds rate in the United States. Banks lending at the OIS do not swap principal, so counterparty risk in the OIS is minimal. By contrast, the Euribor rate is the rate offered for unsecured interbank lending. Thus, the spread between the two isolates counterparty risk.

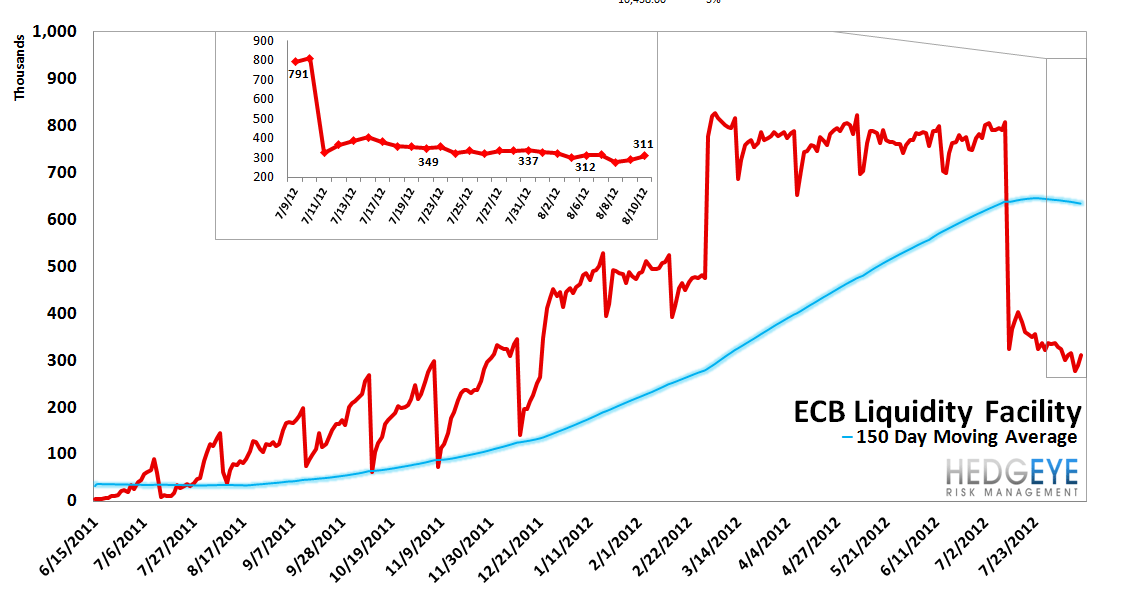
10. ECB Liquidity Recourse to the Deposit Facility – The ECB Liquidity Recourse to the Deposit Facility measures banks’ overnight deposits with the ECB. Taken in conjunction with excess reserves, the ECB deposit facility measures excess liquidity in the Euro banking system. An increase in this metric shows that banks are borrowing from the ECB. In other words, the deposit facility measures one element of the ECB response to the crisis.
11. Markit MCDX Index Monitor – Last week spreads tightened 10 bps, ending at 141 bps versus last Friday's print of 151 bps the prior week. The Markit MCDX is a measure of municipal credit default swaps. We believe this index is a useful indicator of pressure in state and local governments. Markit publishes index values daily on six 5-year tenor baskets including 50 reference entities each. Each basket includes a diversified pool of revenue and GO bonds from a broad array of states. We track the 16-V1.

12. Chinese Steel – Steel prices in China fell 1.2% last week, or 44 yuan/ton, to 3,622 yuan/ton. In the last few months, Chinese construction steel prices have fallen ~10%. This index is reflecting significant weakness in China's construction market. Chinese steel rebar prices have been generally moving lower since August of last year. We use Chinese steel rebar prices to gauge Chinese construction activity, and, by extension, the health of the Chinese economy.
13. 2-10 Spread – Last week the 2-10 spread widened 8 bps last week to 140 bps, and is now up more than 20 bps from its late July lows. We track the 2-10 spread as an indicator of bank margin pressure.

14. Our Macro team’s quantitative setup in the XLF shows 0.7% upside to TREND resistance of $14.90 and 0.9% downside to TRADE support of $14.57.

Margin Debt - June: +0.72 standard deviations
NYSE Margin debt rose in June to $285 billion from $279 billion in May. We like to to look at margin debt levels as a broad contrarian sentiment indicator. For reference, our approach is to look at it margin debt levels in standard deviation terms over the period 1. Our analysis shows that when margin debt gets to +1.5 standard deviations or greater, as it did in April of 2011, it has historically been a signal of extreme risk in the equity market. The preceding two instances were followed by the equity market losing roughly half its value. Overall this setup represents a long-term headwind for the market. One limitation of this series is that it is reported on a lag. The chart shows data through June.

Joshua Steiner, CFA
Robert Belsky
Having trouble viewing the charts in this email? Please click the link at the bottom of the note to view in your browser.
