In 2Q12 Singapore experienced its gross gaming revenue decline, falling 2% YoY and 17% QoQ
In 2Q12 Singapore gross gaming revenues fell 2% YoY and 17% QoQ to S$1.736BN. For comparison, 2Q Macau GGR was flat QoQ and up 14% YoY. Singapore property EBITDA also experienced its first YoY and QoQ decline to S$734MM, falling 14% YoY and 25% QoQ.
Q2 hold was 2.74%, the lowest quarterly hold rate experienced by the market and way below Singapore’s historical hold rate of 3.06%. Hold was also weak in 2Q11 at 2.82%. If we use 3% to normalize VIP revenues, GGR would have been S$1.81BN and up 1% YoY but still down 7% QoQ.
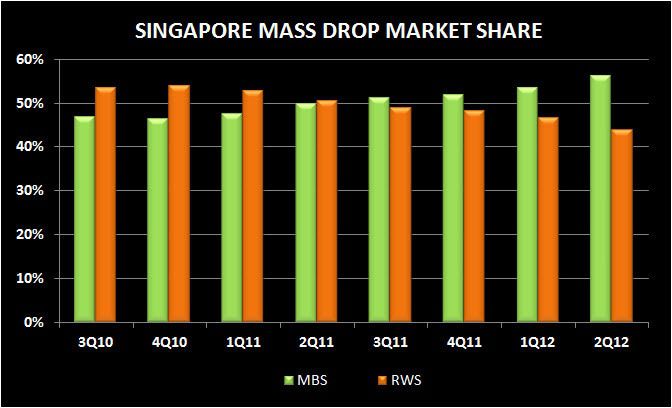
For the 3rd consecutive quarter, RC turnover declined YoY. In 2Q, RC turnover was S$28.2BN, down 11% YoY and QoQ. We estimate that while slot and ETG handle grew 21%, mass drop fell 2% YoY to S$7.2BN and S$2.7BN. We have seen the number of slots and ETGs expand by 21% YoY to 4,934 while the total number of tables has only grown 2% over the same period to 1,173.
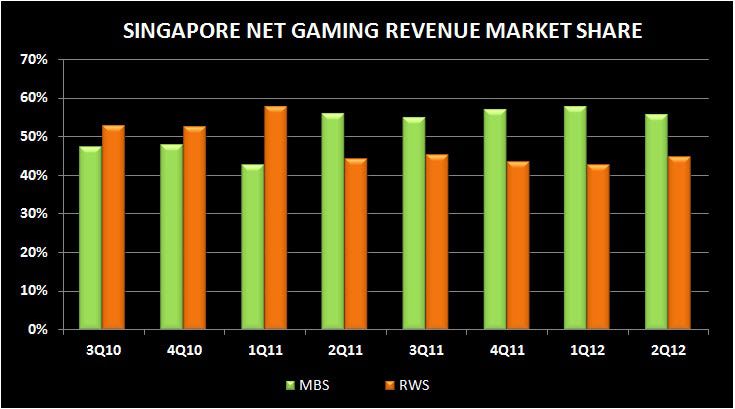
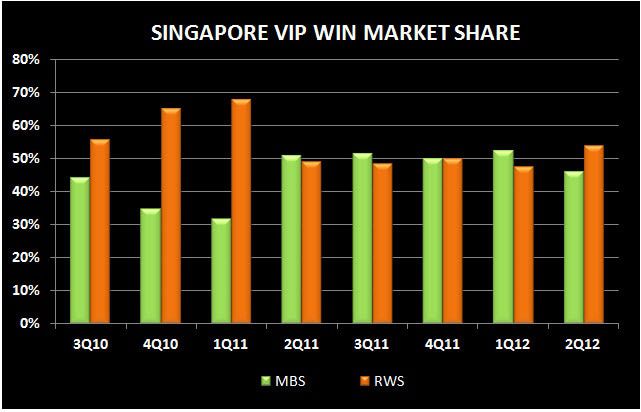
As a result of MBS’s very low hold percentage, RWS did manage to gain share sequentially across GGR, net casino revenue, EBITDA, VIP win, and slot win. MBS gained sequential share across the following metrics: VIP RC, slot handle, mass win and drop.