Key Takeaways
* Last week was interesting as rising confidence around an ECB-led bailout gave way to disappointment, only to be followed by an extraordinary rally on better than expected US econ data. All told, both Sovereign and company-specific default swaps were broadly tighter last week.
*The average rate on high yield corporate debt dropped 20 bps last week, another sign that the market thinks risk is off the table in the short-term.
* The MCDX index fell significantly last week. We remain puzzled by this considering the recent spate of muni bankruptcy filings.
* XLF Macro Quantitative Setup – Our Macro team’s quantitative setup in the XLF shows 0.5% upside to TREND resistance of $14.89 and 1.8% downside to TRADE support of $14.56. The XLF is currently bullish TRADE, bearish TREND.
Financial Risk Monitor Summary
• Short-term(WoW): Positive / 7 of 12 improved / 1 out of 12 worsened / 5 of 12 unchanged
• Intermediate-term(WoW): Positive / 5 of 12 improved / 2 out of 12 worsened / 6 of 12 unchanged
• Long-term(WoW): Positive / 6 of 12 improved / 3 out of 12 worsened / 4 of 12 unchanged

1. US Financials CDS Monitor – The money center banks (JPM, BAC, C, WFC) and the large U.S. brokers (GS, MS) all saw credit default swaps tighten again last week.
Tightened the most WoW: RDN, AIG, MMC
Widened the mos WoW: COF, MTG, GNW
Tightened the most MoM: MET, ALL, XL
Widened the most MoM: MTG, MBI, GNW

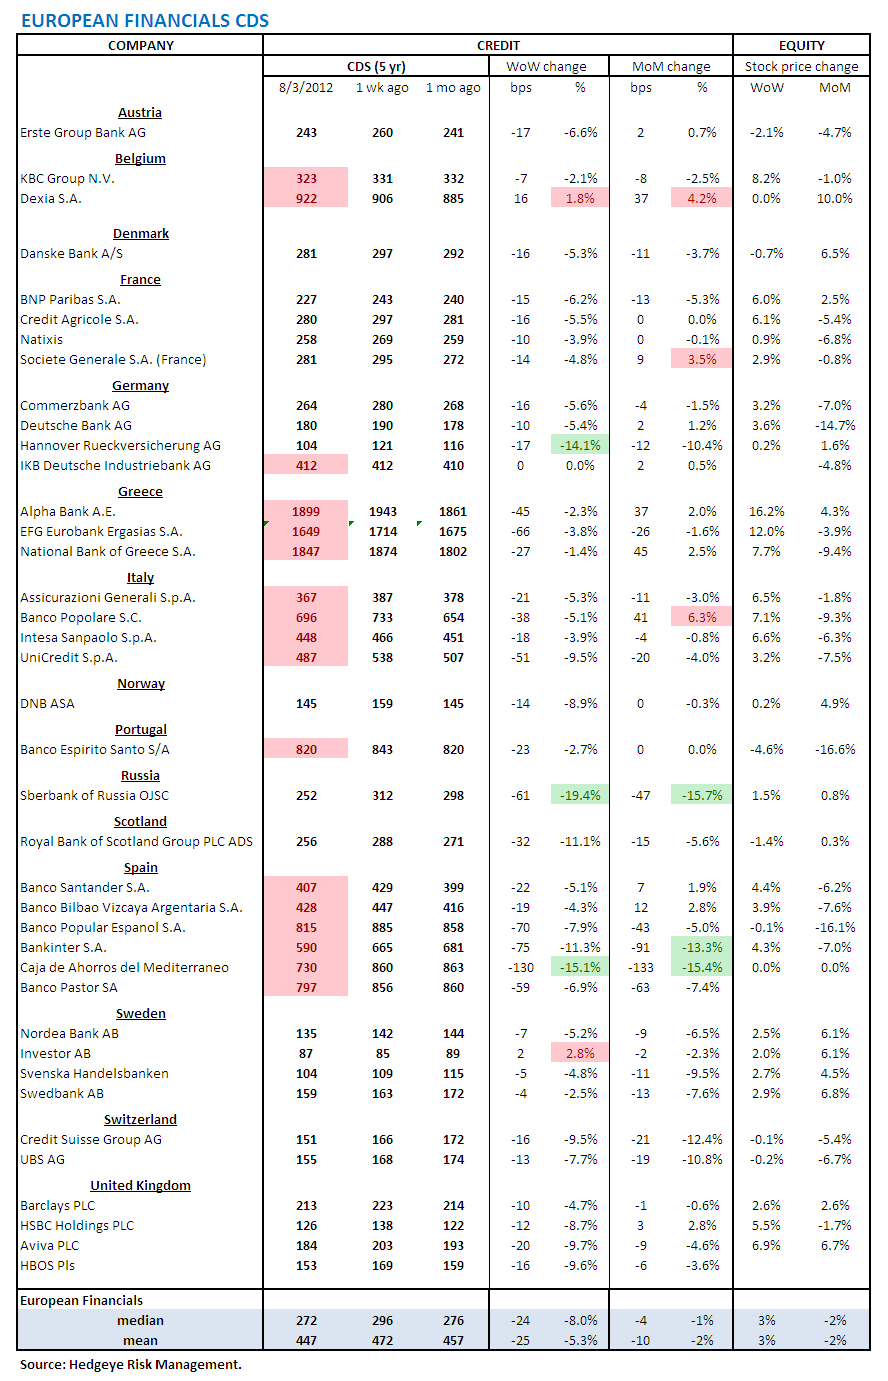
2. European Financial CDS - Spanish, German, French, Italian and Greek banks tightened. Overall, 37 of the 39 European financial reference entities we track saw spreads tighten last week.
3. Asian Financial CDS - China and India posted notable tightening, while Japanese financials were largely flat.

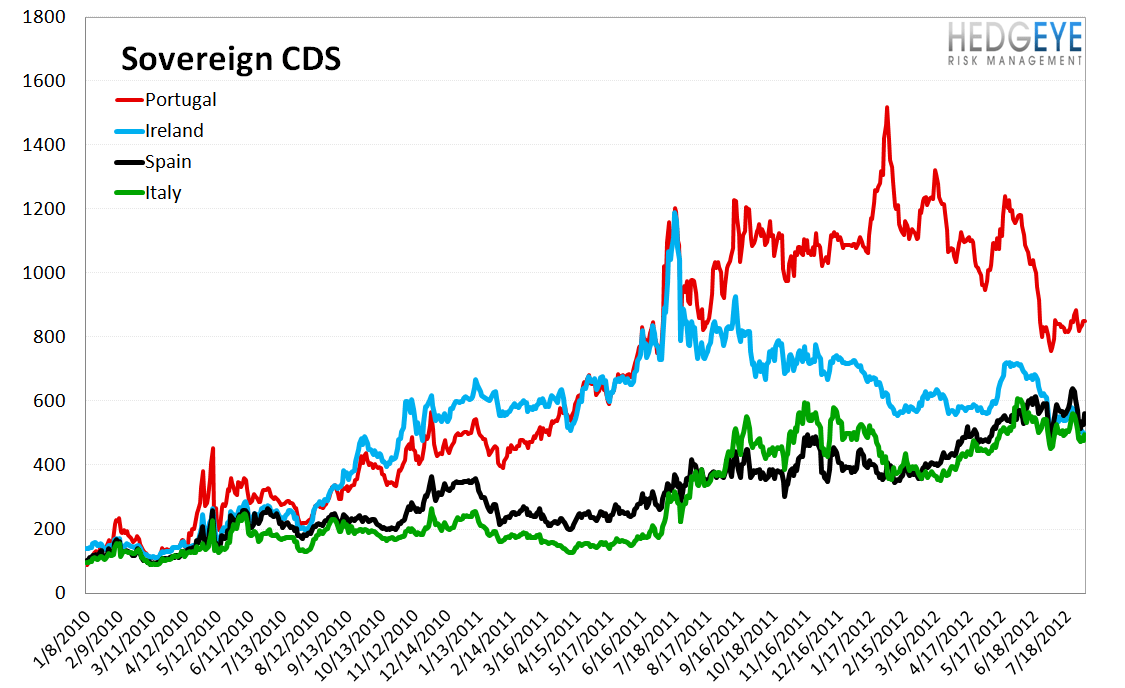
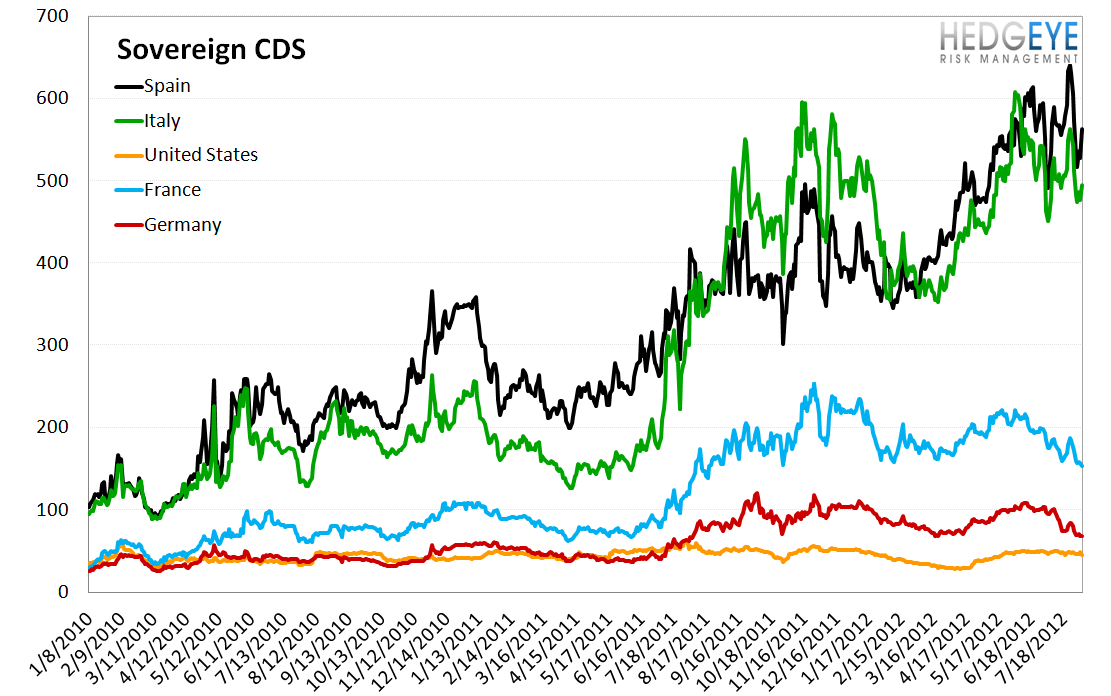
4. Sovereign CDS – European Sovereign Swaps tightened across the board last week. In Europe, French sovereign swaps tightened the most: -18 bps to 154 bps while Portuguese sovereign swaps tightened the least: -4 bps to 852 bps.

5. High Yield (YTM) Monitor – High Yield rates fell 20 bps last week, ending the week at 7.09 versus 7.29 the prior week.

6. Leveraged Loan Index Monitor – The Leveraged Loan Index rose 5.15 points last week, ending at 1689.

7. TED Spread Monitor – The TED spread rose 1.8 points last week, ending the week at 36.1 this week versus last week’s print of 34.3.

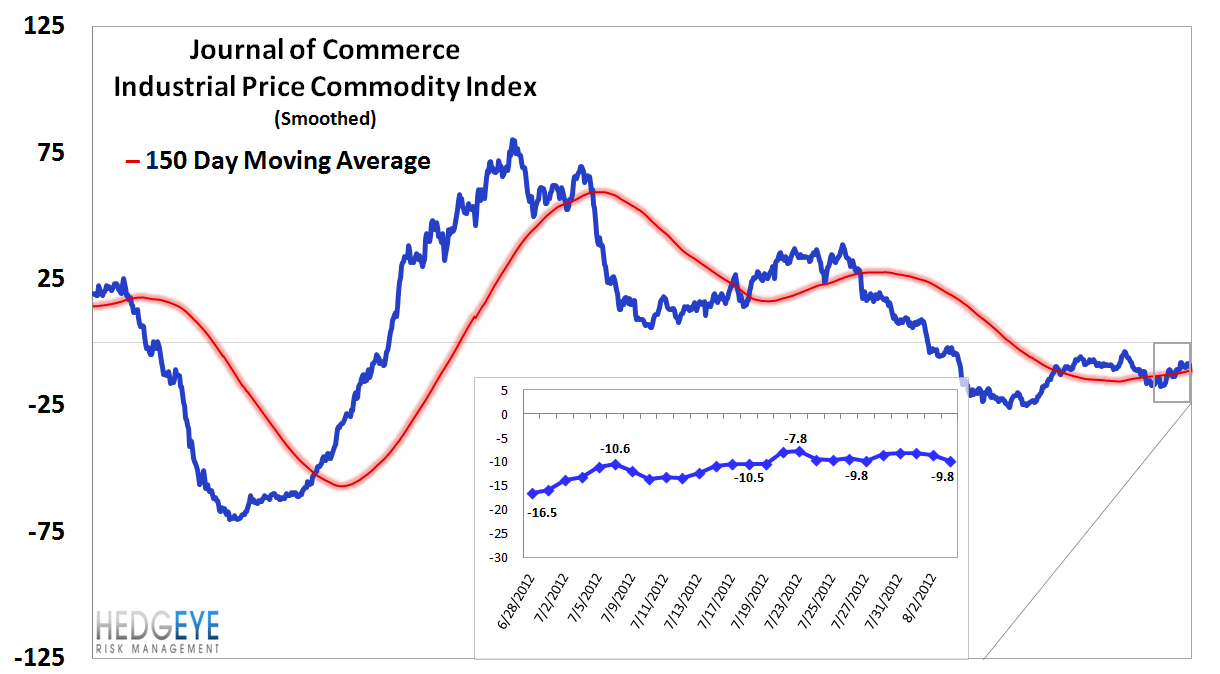
8. Journal of Commerce Commodity Price Index – The JOC index was flat, ending the week at -9.8.
9. Euribor-OIS spread – The Euribor-OIS spread tightened by 6 bps to 29 bps. The Euribor-OIS spread (the difference between the euro interbank lending rate and overnight indexed swaps) measures bank counterparty risk in the Eurozone. The OIS is analogous to the effective Fed Funds rate in the United States. Banks lending at the OIS do not swap principal, so counterparty risk in the OIS is minimal. By contrast, the Euribor rate is the rate offered for unsecured interbank lending. Thus, the spread between the two isolates counterparty risk.

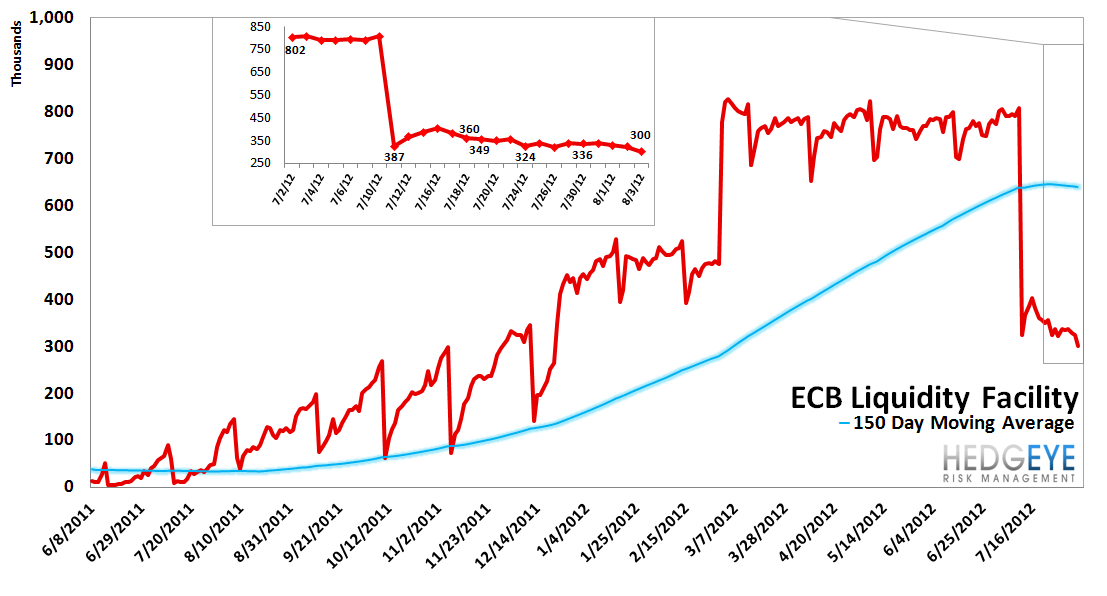
10. ECB Liquidity Recourse to the Deposit Facility – The ECB Liquidity Recourse to the Deposit Facility measures banks’ overnight deposits with the ECB. Taken in conjunction with excess reserves, the ECB deposit facility measures excess liquidity in the Euro banking system. An increase in this metric shows that banks are borrowing from the ECB. In other words, the deposit facility measures one element of the ECB response to the crisis.
11. Markit MCDX Index Monitor – Last week, MCDX spreads tightened by 12 bps, the index ended the week at 151 bps. The Markit MCDX is a measure of municipal credit default swaps. We believe this index is a useful indicator of pressure at the state and local government level. Markit publishes index values daily on six 5-year tenor baskets including 50 reference entities each. Each basket includes a diversified pool of revenue and GO bonds from a broad array of states.

12. Chinese Steel – Steel prices in China were flat last week at 3,666 yuan/ton, though in the last few months Chinese construction steel prices are down ~10%. Chinese steel rebar prices have been generally moving lower since August of last year. We use Chinese steel rebar prices to gauge Chinese construction activity, and, by extension, the health of the Chinese economy.

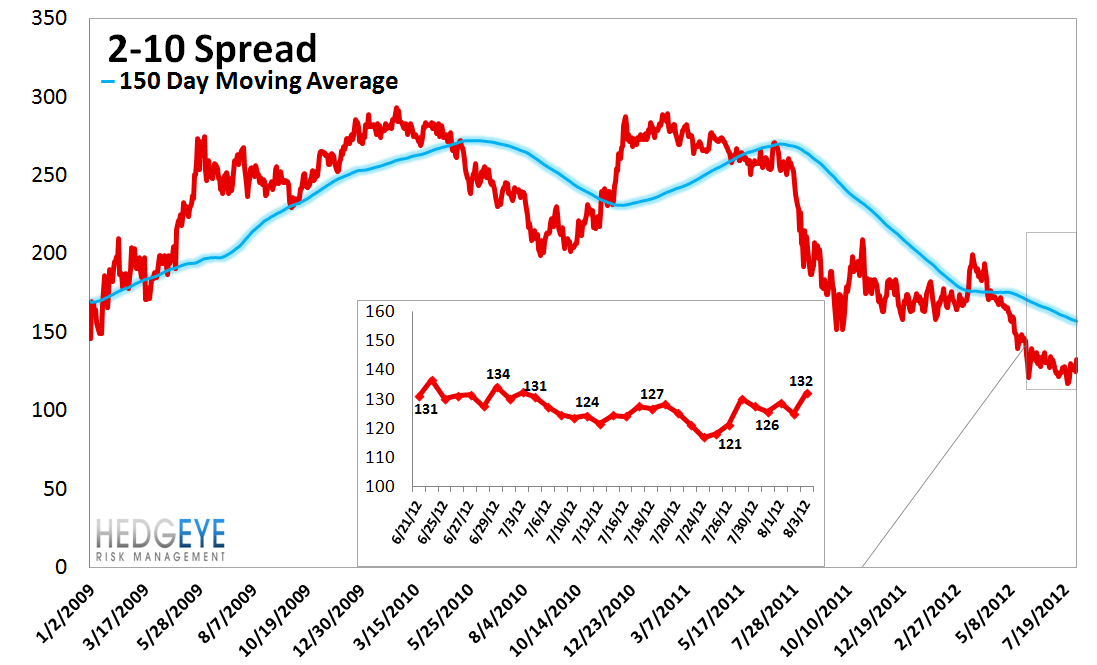
13. 2-10 Spread – Last week the 2-10 spread widened 2 bps week-over-week to 132 bps. We use the 2-10 yield spread as a broad measure of bank margin pressure.
14. XLF Macro Quantitative Setup – Our Macro team’s quantitative setup in the XLF shows 0.5% upside to TREND resistance of $14.89 and 1.8% downside to TRADE support of $14.56. The XLF is currently bullish TRADE, bearish TREND.

Margin Debt - June: +0.72 standard deviations
NYSE Margin debt rose in June to $285 billion from $279 billion in May. We like to to look at margin debt levels as a broad contrarian sentiment indicator. For reference, our approach is to look at it margin debt levels in standard deviation terms over the period 1. Our analysis shows that when margin debt gets to +1.5 standard deviations or greater, as it did in April of 2011, it has historically been a signal of extreme risk in the equity market. The preceding two instances were followed by the equity market losing roughly half its value. Overall this setup represents a long-term headwind for the market. One limitation of this series is that it is reported on a lag. The chart shows data through June.

Joshua Steiner, CFA
Robert Belsky
Having trouble viewing the charts in this email? Please click the link at the bottom of the note to view in your browser.
