Our macro team has taken a cavalcade of data and examined it with an objective viewpoint to determine just how well we’re doing since the 2007 housing crisis that led to the 2008 financial crisis. The results? A meaningful housing recovery is years upon years away but the US market seems to have stabilized – a positive catalyst for the US dollar and economy.
Mortgage rates are absurdly cheap right now. Perhaps you read about Facebook Founder and CEO Mark Zuckerberg refinancing his estate at a 1%. If the government’s plan was to flood the US with cheap money, it’s certainly working out quite nicely.
It’s important to understand that the US housing market has two large underpinnings to it. First, a house is the primary asset for many Americans. As the value of a house increases, so does their net worth, and their confidence related to future spending. Second, homebuilding and construction is a major driver of employment in the U.S. As the chart below highlights, more than 2 million jobs were shed in the construction sector since 2006, of which almost none have come back.

According to recent data from the National Association of Realtors, housing inventory is at the lowest level since June 2002. Looking at the chart below, you can see that 2011 saw a massive drop in the amount of available homes. The recent uptick is merely cyclical and inventory is expected to continue to improve.

One of the biggest metrics of course is home prices. If anything, the perception alone is a major concern for the US homeowner as a person’s house is their single largest asset they own. Home prices go up, net worth goes up; it’s a beautiful thing – even if it did lead to a bubble that popped in the late 2000s.
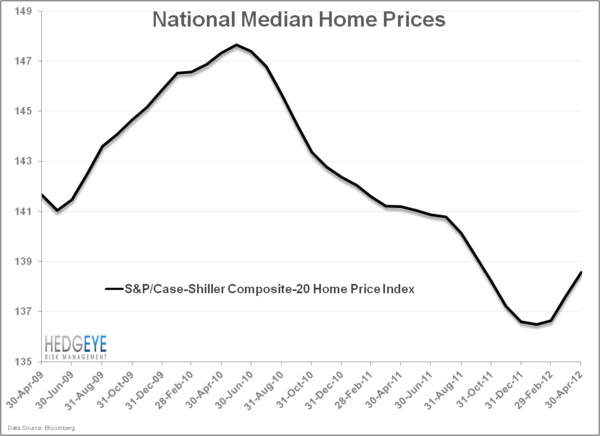
The chart below highlights the Case-Shiller national median home price going back three years. The national median home price, at least according to this series, bottomed in the first couple of months of 2012 and has been on the rebound for the last few months according to data through April. This is corroborated by data released from Zillow that shows the median home price nationwide was up 0.2% year-over-year in Q2 2012 for the first time in five years.
So what does this all mean? It means we’re a lot better off than we were five years ago. The overall enthusiasm in this recovery is a good thing, but we would caution on expecting an accelerating recovery from these levels because of both the large amount of shadow inventory and artificially low level of interest rates.
