“If one side of every transaction is wrong, we have to ponder why we should think it’s not us.”
-Howard Marks
Yesterday afternoon, as I was flying back to New York from California, I was watching the market go against me by -0.12% (I’m short the SP500 at 1375). It’s never easy taking The Other Side of a market up move. Being a successful short seller in this business is the ultimate game of survival. Your skin needs to be thick, and you need to be able to take a punch.
I’ve made thousands of short sales in my career. Each time feels different. Feeling in this profession is what you’re not supposed to do. But you do. You’re going to feel the love when you are right. You’re going to feel shame when you are wrong. No matter what you are feeling, the best advice I can give is to keep searching – keep asking yourself what you’re missing.
Mr Macro Market is usually pretty good at reminding you when and where you could be wrong. That makes our search easier. Embracing the uncertainty that each and every dynamic risk management factor throughout each day brings is at the core of what I do. As Howard Marks wrote in his recent June letter: “Active management has to be seen as the search for mistakes.”
Back to the Global Macro Grind…
The Other Side of the bear case for the SP500 is the current bull case – bailouts. Yesterday’s US economic data was awful. US Leading Indicators (LEI) slowed -0.3% in June versus +0.4% in May. Existing Home Sales for June dropped -5.4% and weekly US jobless claims shot straight back up to their YTD highs of 386,000.
So, on the “news” the market sold off and went red for an hour or so, but quickly recovered and went green as more #BailoutBull calls for Qe5 re-surfaced. In conjunction with the Bernanke Begging, the US Dollar went down, Oil went straight up, and all was well in the land of another no-volume stock market rally to lower long-term highs (-12% from the 2007 peak).
So what’s on The Other Side of the other side? What happens if the Global Macro and US Economic data goes bullish? Would that make me more wrong being short the SP500 (and Oil, we shorted that at yesterday’s highs too)? Or would that just make me wrong on my research view which, in turn, takes out the #BailoutBull and makes me more right for the wrong reasons?
Who knows…
Regardless, this is starting to sound all too complex for we commoners being centrally planned by the 112th to simplify.
The Other Side of the bull case for this SP500 rally to continue has 3 core factors:
- PRICE – SP500 immediate-term TRADE overbought anywhere > 1375
- VOLATILITY – VIX immediate-term TRADE oversold anywhere < 16
- VOLUME – continuing to register the nastiest volume signals ever in my model
That last factor was easily the most controversial topic I debated with clients in CA this week. Since US Equities continue to see outflows, where is the stock market’s bid coming from? I say short covering. And the ultimate question we need to answer this morning is how much of that do we have left?
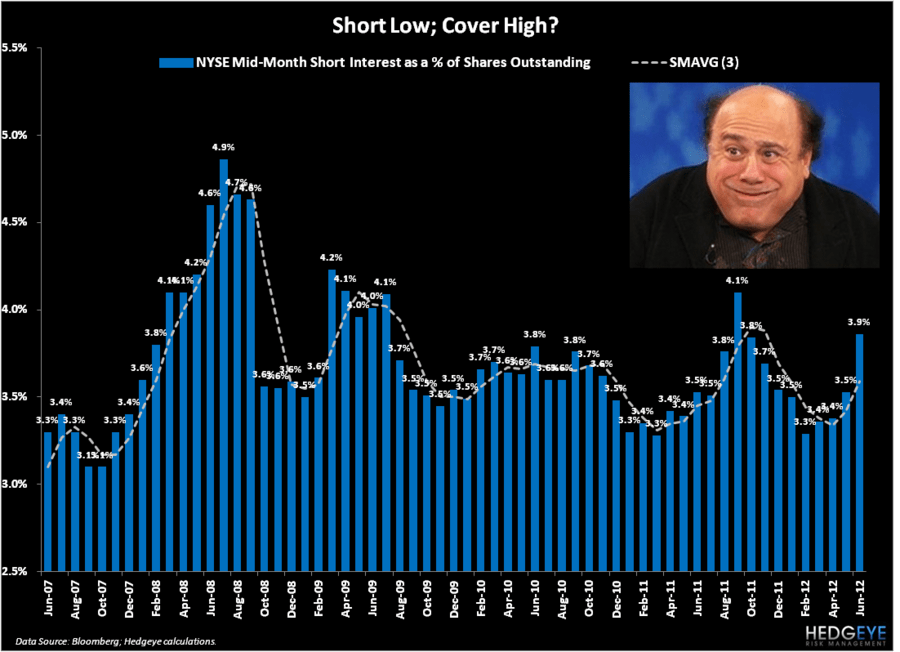
The good news is that short interest data is trivial. Darius Dale highlights one way to look at long-term short-interest as today’s Chart of The Day. What you’ll note in this chart is that short interest as a % of the NYSE shares outstanding has been oscillating between 3-5% since this whole gong show of free money bailouts started in late 2007.
What you’ll also notice is that short interest spiked back up to 3.86% in June 2012, but that it came from a relatively low place (on a 5 year basis) for the 4-6 months prior to that. Yes, Beta Hedgies short low and cover high.
Are the consensus hedge fund short sellers covering high when the VIX goes low, again? I can literally see it in each security I am bear hunting in. Where I could be wrong is if I am hunting in the wrong neck of the woods. If I am right, eviscerated short interest looks like it’s turning into a huge market liability. Markets fall fastest after the consensus shorts have covered.
Where else could I be wrong on this? All over the place. What if short interest is absolutely ripping to the upside (4-5% of total shares outstanding) here in July? What if no one has covered any of their shorts this week? What if it really is different this time and 15 VIX is a cover all your shorts signal?
Only time will tell. But, in the meantime, I can assure you of this – very few PMs understood this in Q4 of 2008. Remember when every fundamental #GrowthSlowing short seller was being dared to cover their shorts in fear of the next central plan? Remember “shock & awe” rate cuts and Hank Paulson’s “bazooka” daily whip around in the market?
I do. And so does Santayana: “Those who cannot remember the past are condemned to repeat it.”
My immediate-term support and resistance ranges for Gold, Oil (Brent), US Dollar, EUR/USD, Italy’s MIB Index, and the SP500 are now $1, $102.28-108.79, $82.75-83.94, $1.21-1.23, 13,468-13,703, and 1, respectively.
Best of luck out there today and have a great weekend,
KM
Keith R. McCullough
Chief Executive Officer