Key Takeaways
* Last week we flagged the divergence between European bank swaps and European sovereign swaps as the former were moving higher while the latter tightened. Apparently the banks remain the tail wagging the dog in Europe, as this week European sovereign swaps are higher as uncertainty once again dominates headlines. This week there is less ambiguity. German, Italian and Spanish bank swaps were broadly wider last week while French bank swaps were mixed. This is consistent with what we saw in the sovereigns.
* Interestingly, US Banks broadly improved last week (both swaps and stocks). This surprises us for two reasons. First, the emerging Libor scandal will be an enormous overhang for the US banks involved in setting Libor rates. However, as it did with mortgage putbacks, this could take some time for the markets to fully synthesize the size and scope of what's going on here. Second, with European banks and sovereigns moving lower, the positive divergence in US banks seems unsustainable.
* One possible justification for the positive move in US banks was the the ECB and the People’s Bank of China decision to cut their benchmark rates last week while the Bank of England increased the size of its asset-purchase program. We would again be skeptical. Rate cuts, when rates are already as low as they are, offer little incremental stimulus. Moreover, encouraging more borrowing through cheaper money is not the solution to Europe's problem of overindebtedness.
* UK banks were big losers last week as the Libor scandal heats up. Barclays was the outsized loser as its swaps rose 27 bps to 232 bps.
* XLF: Slightly more upside. Our Macro team’s quantitative setup in the XLF shows 3.3% upside to TREND resistance of $14.95 and 2.2% downside to TRADE support at $14.15.
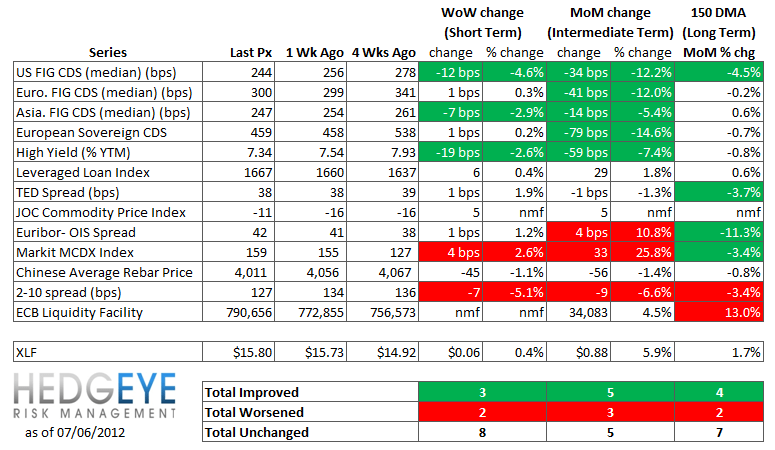
Financial Risk Monitor Summary
• Short-term(WoW): Positive / 3 of 12 improved / 2 out of 12 worsened / 8 of 12 unchanged
• Intermediate-term(WoW): Positive / 5 of 12 improved / 3 out of 12 worsened / 5 of 12 unchanged
• Long-term(WoW): Positive / 4 of 12 improved / 2 out of 12 worsened / 7 of 12 unchanged
1. US Financials CDS Monitor – Swaps tightened across all 27 major domestic financial company reference entities last week.
Tightened the most WoW: MTG, RDN, MBI
Widened the most/ tightened the least WoW: Met, UNM, HIG
Tightened the most MoM: WFC, RDN, MBI
Widened the most/ tightened the least MoM: LNC, UNM, GNW

2. European Financial CDS - UK, Spanish, Italian French and German banks saw swaps widen last week. Greek banks tightened.
Overall, 21 of the 39 European financial reference entities we track saw spreads widened last week. The median widening was 0.33% and the mean widening was 1.03%.

3. Asian Financial CDS - 11 of the 12 Asian banks we track saw swaps tighten last week.

4. European Sovereign CDS – Spain and Portugal widened sharply while Italy widened nominally. Ireland was significantly tighter week over week on the heels of their re-entry into the sovereign debt market.


5. High Yield (YTM) Monitor – High Yield rates fell 19 bps last week, ending the week at 7.34 versus 7.54 the prior week.

6. Leveraged Loan Index Monitor – The Leveraged Loan Index rose 6 points last week, ending at 1667.

7. TED Spread Monitor – The TED spread rose 0.7 bps last week, ending the week at 38.41 this week versus last week’s print of 37.69.

8. Journal of Commerce Commodity Price Index – The JOC index rose 4.8 points, ending Thursday at -11.1 versus -15.9 the prior Friday.

9. Euribor-OIS spread – The Euribor-OIS spread widened by 1 bps to 42 bps.The Euribor-OIS spread (the difference between the euro interbank lending rate and overnight indexed swaps) measures bank counterparty risk in the Eurozone. The OIS is analogous to the effective Fed Funds rate in the United States. Banks lending at the OIS do not swap principal, so counterparty risk in the OIS is minimal. By contrast, the Euribor rate is the rate offered for unsecured interbank lending. Thus, the spread between the two isolates counterparty risk.

10. ECB Liquidity Recourse to the Deposit Facility – This index remains near its all time peak. The ECB Liquidity Recourse to the Deposit Facility measures banks’ overnight deposits with the ECB. Taken in conjunction with excess reserves, the ECB deposit facility measures excess liquidity in the Euro banking system. An increase in this metric shows that banks are borrowing from the ECB. In other words, the deposit facility measures one element of the ECB response to the crisis. This chart shows data through Thursday.

11. Markit MCDX Index Monitor – Municipal spreads widened 4 bps last week, ending at 159 bps. The Markit MCDX is a measure of municipal credit default swaps. We believe this index is a useful indicator of pressure in state and local governments. Markit publishes index values daily on six 5-year tenor baskets including 50 reference entities each. Each basket includes a diversified pool of revenue and GO bonds from a broad array of states. We track the 16-V1.

12. Chinese Steel - Steel prices in China fell 1.1% last week, or 45 yuan/ton, to 4,011 yuan/ton. Notably, Chinese steel rebar prices have been generally moving lower since August of last year. We use Chinese steel rebar prices to gauge Chinese construction activity, and, by extension, the health of the Chinese economy. We look at the average Chinese rebar spot price.

13. 2-10 Spread – Last week the 2-10 spread tightened by 7 bps to 127 bps. While admittedly imperfect, we think this is a useful reference for bank margin pressure.

14. XLF Macro Quantitative Setup – Slightly more upside. Our Macro team’s quantitative setup in the XLF shows 3.3% upside to TREND resistance of $14.95 and 2.2% downside to TRADE support at $14.15.

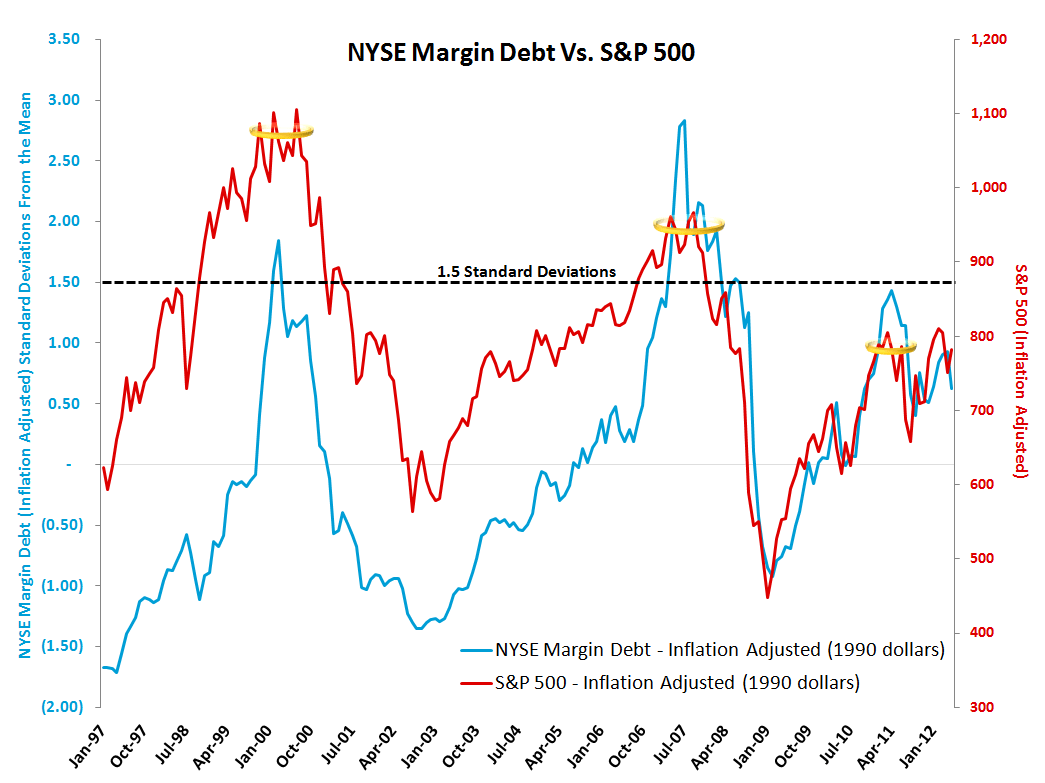
Margin Debt - May: +0.63 standard deviations
NYSE Margin debt fell in May to $279 billion from $298 billion in April. We like to to look at margin debt levels as a broad contrarian sentiment indicator. For reference, our approach is to look at it margin debt levels in standard deviation terms over the period 1. Our analysis shows that when margin debt gets to +1.5 standard deviations or greater, as it did in April of 2011, it has historically been a signal of extreme risk in the equity market. The preceding two instances were followed by the equity market losing roughly half its value. Overall this setup represents a long-term headwind for the market. One limitation of this series is that it is reported on a lag.
The chart shows data through May.
Joshua Steiner, CFA
Robert Belsky
Having trouble viewing the charts in this email? Please click the link at the bottom of the note to view in your browser.
