Jumping back to the JUN jobs report, the key takeaway from our analysis is that the US labor market remains firmly stuck in the mud, failing to improve or outright deteriorating on a number of key metrics:
• Non-Farm Payrolls, Net of Birth-Death Adjustment YoY: -43k from +138k
• Headline Unemployment Rate SA: flat at 8.2%
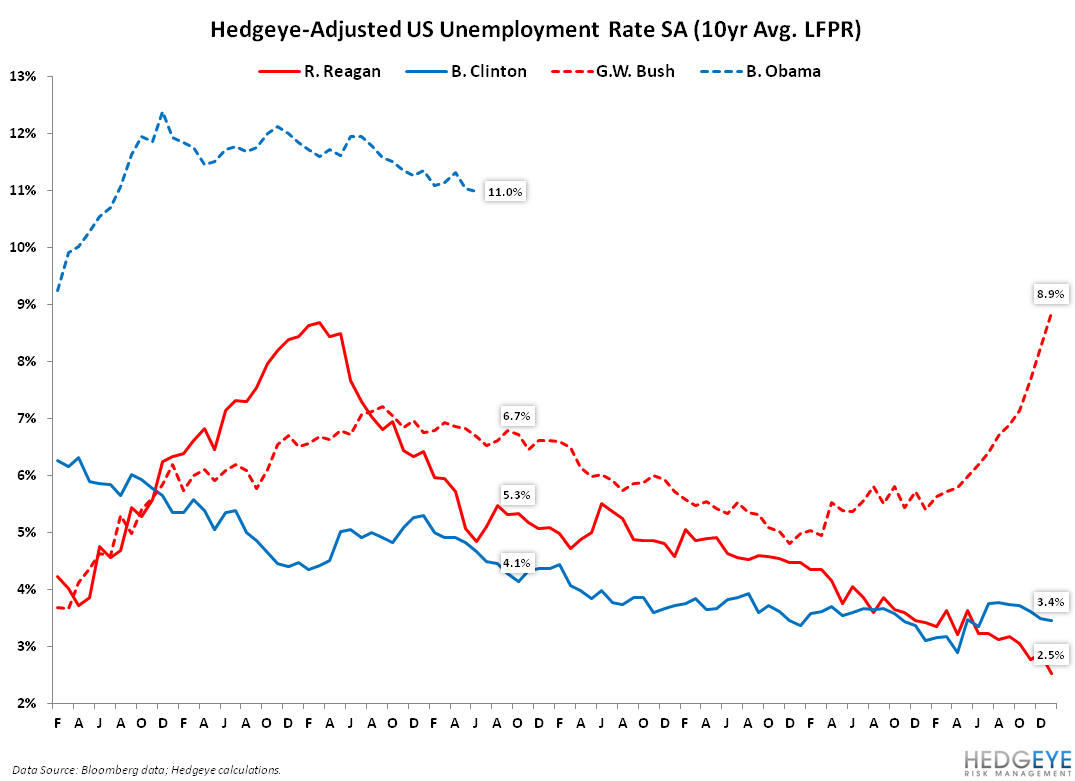
• Hedgeye-Adjusted Unemployment Rate SA (10YR Average Labor Force Participation Rate): flat at 11%
• Unemployed-to-Working-Age-Population Ratio SA: flat at 41.4%
• Labor Force Non-Participation Rate SA: flat at 36.2%
Not that anyone was expecting a major step forward, but it’s clear that the data firmly implies the US labor market remains far worse off than the headline Unemployment Rate (SA) of 8.2% would suggest. You know conditions are not good when an 8.2% Unemployment Rate is being touted as an indicator of “strength” on the incumbent’s campaign trail. Perhaps the populace buys it, perhaps they don’t; we’ll see come NOV 6th. For now, a rigorous analysis of the data (as opposed to overreacting to the headline print) would suggest that Obama’s odds of reelection may be less than indicated by various polls, as well as the latest reading from our Hedgeye Election Indicator.