Key Takeaways
* US/European bank swaps were broadly tighter last week on the heels of favorable Greek elections and Moody's downgrades being less bad than feared. We'd remind investors that (a) even if Greek austerity terms are eased, the rate of contraction in the Greek economy will make compliance nearly impossible, setting the stage for another showdown, and (b) Moody's downgrades have costs. While we saw lots of commentary about funding costs not being affected by the downgrades, the more salient takeaway is that institutions that moved to triple-B should see derivatives flow move away, on the margin.
* Risk took a breather last week as large declines in high yield, MCDX and higher leveraged loan prices were indications that the temporary calm in Europe was enough for a broad-based rally. Interestingly, the one measure you'd have expected to contract actually expanded: Euribor-OIS.
* The 2-10 spread widened modestly WoW. We expect this increase to be short-lived as the the Fed extended Operation Twist on Wednesday, which will put downward pressure on the long-end of the curve.
* Looking at the week ahead, the setup in the XLF in the short term is roughly even, with 2% upside to $14.62 and 2.5% downside to $13.98.
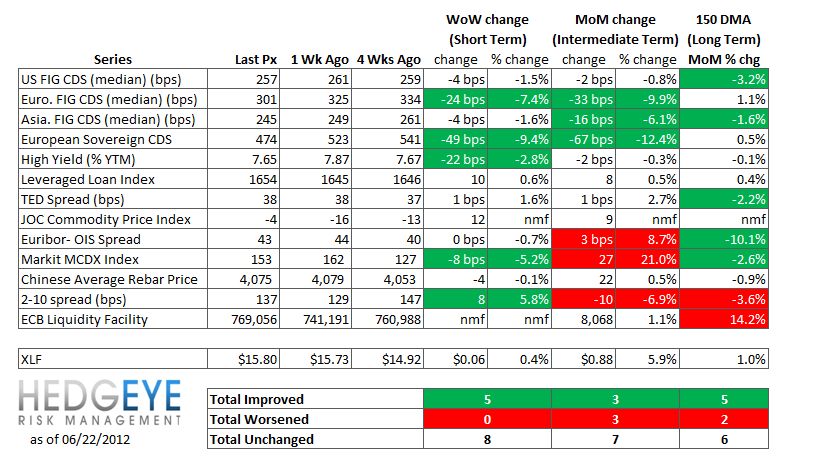
Financial Risk Monitor Summary
• Short-term(WoW): Positive / 5 of 12 improved / 0 out of 12 worsened / 8 of 12 unchanged
• Intermediate-term(WoW): Neutral / 3 of 12 improved / 3 out of 12 worsened / 7 of 12 unchanged
• Long-term(WoW): Positive / 5 of 12 improved / 2 out of 12 worsened / 6 of 12 unchanged
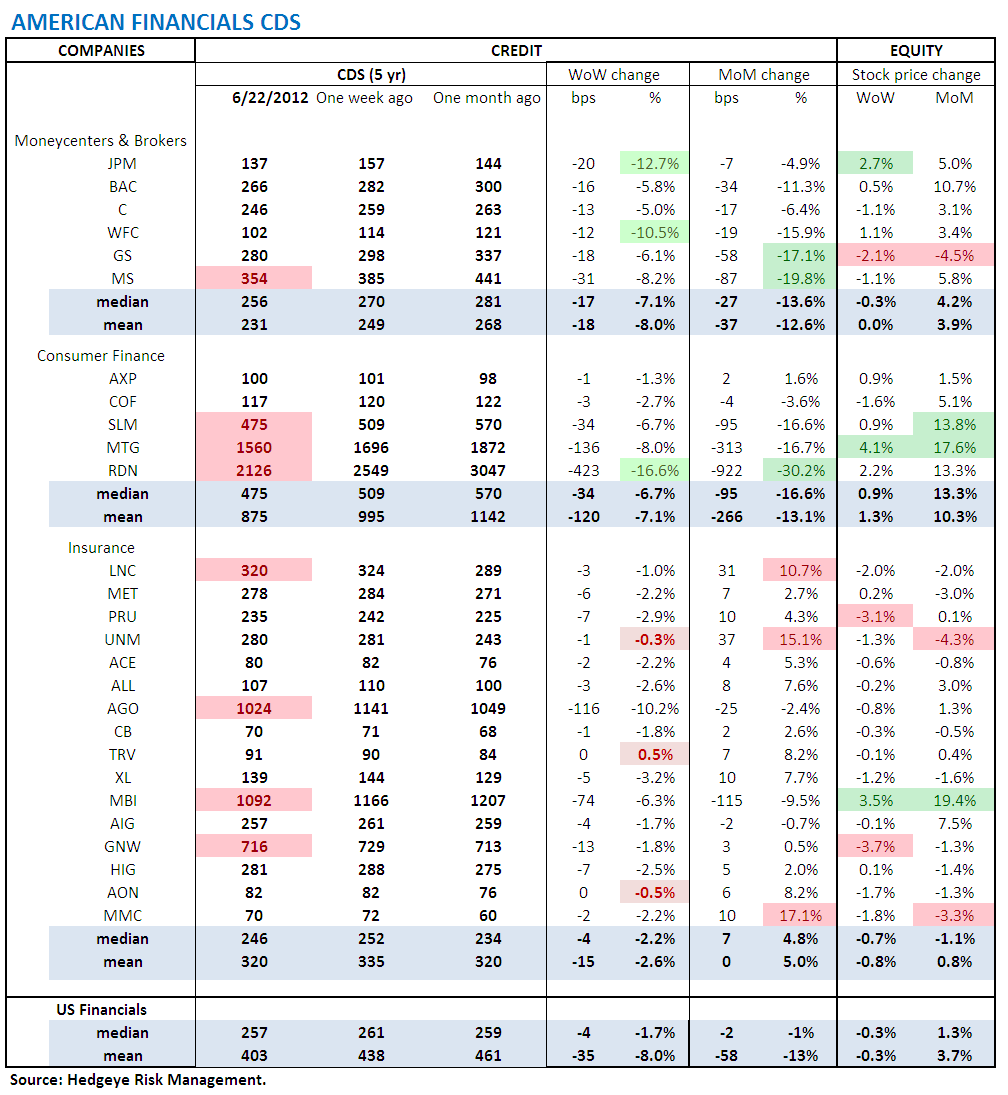
1. US Financials CDS Monitor – Swaps tightened for 26 of 27 major domestic financial company reference entities last week.
Tightened the most WoW: JPM, WFC, RDN
Tightened the least/ widened the most WoW: UNM, TRV, AON
Tightened the most MoM: GS, MS, RDN
Widened the most MoM: LNC, UNM, MMC
2. European Financial CDS - 31 of the 39 European financial reference entities we track saw spreads tighten last week. The median tightening was 7.4% and the mean tightening was 1.8%. It's notable that the Spanish banks were the worst performers of the group.

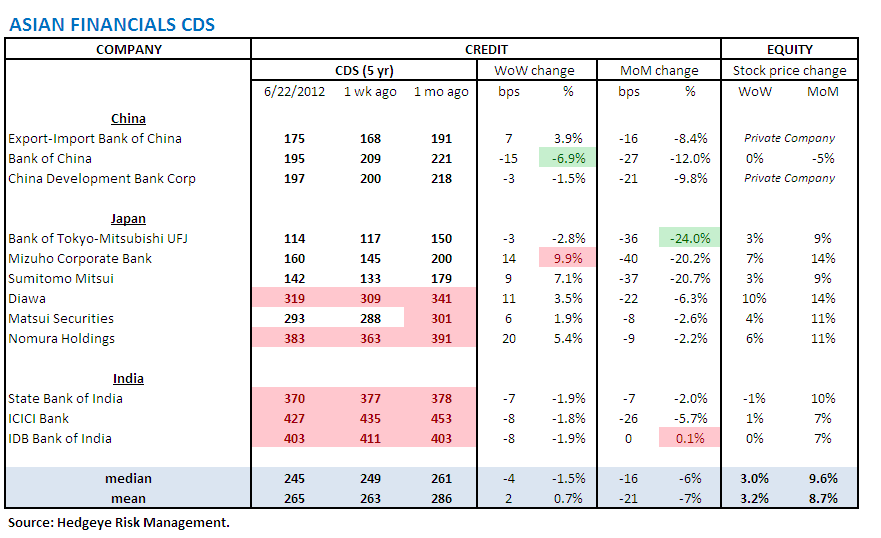
3. Asian Financial CDS - Japanese banks were broadly wider last week, while Indian and Chinese banks tightened. It's interesting to note that Nomura is 383 bps, the widest of any major Japanese Financial Institution.
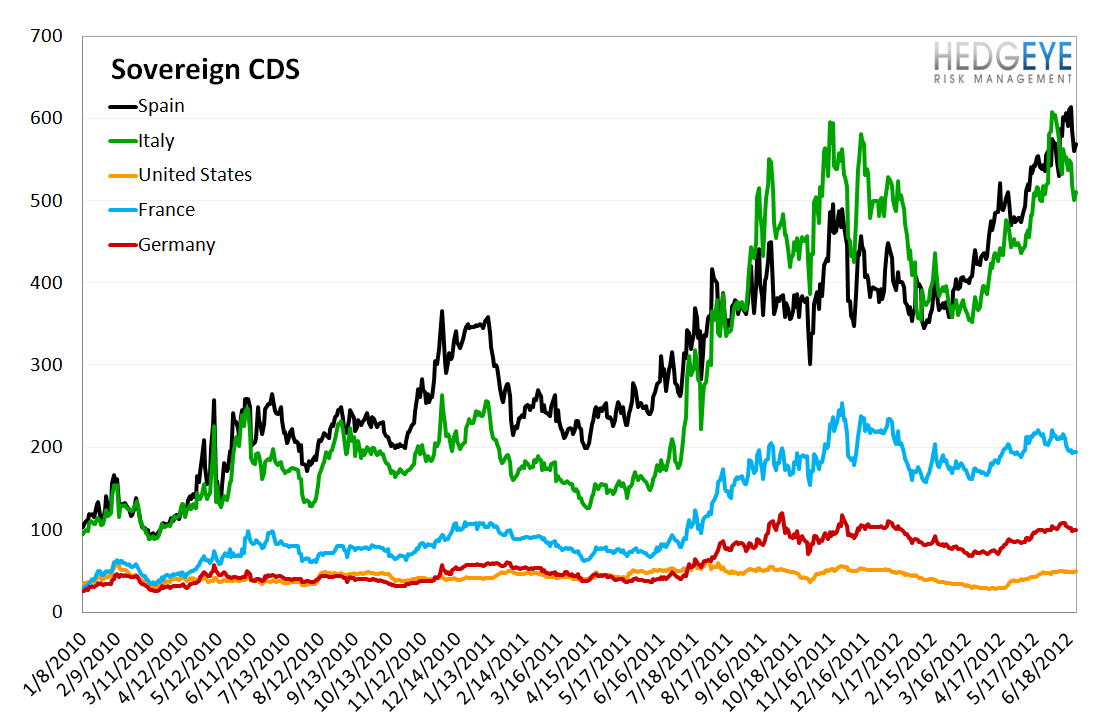
4. European Sovereign CDS – European Sovereign Swaps were mostly tighter last week. Portugal saw the strongest rally as swaps fell by 195 bps to 847 bps. Spain and Italy tightened by 21 bps and 27 bps, to 570 bps and 510 bps, respectively


5. High Yield (YTM) Monitor – High Yield rates fell 22 bps last week, ending the week at 7.65 versus 7.87 the prior week.

6. Leveraged Loan Index Monitor – The Leveraged Loan Index rose 9.84 points last week, ending at 1654.

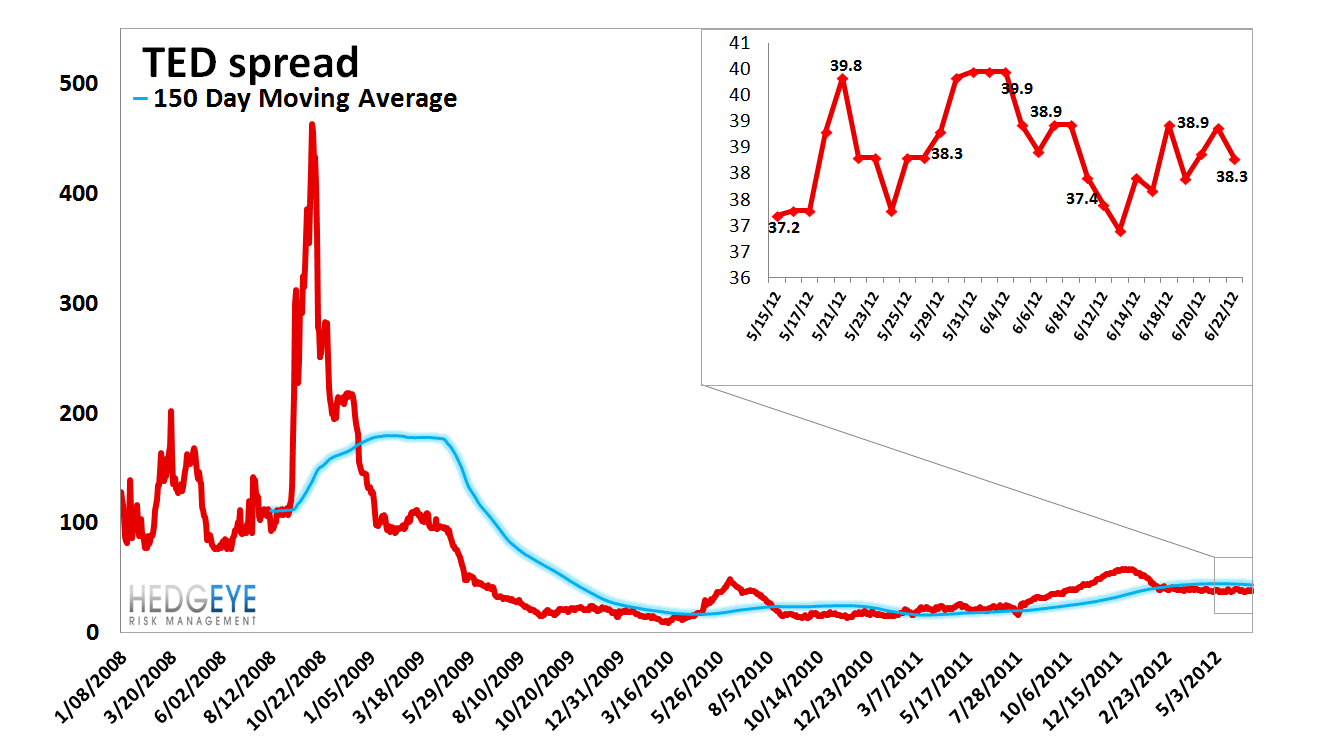
7. TED Spread Monitor – The TED spread rose 0.6 bps last week, ending the week at 38.3 bps this week versus last week’s print of 37.7 bps.
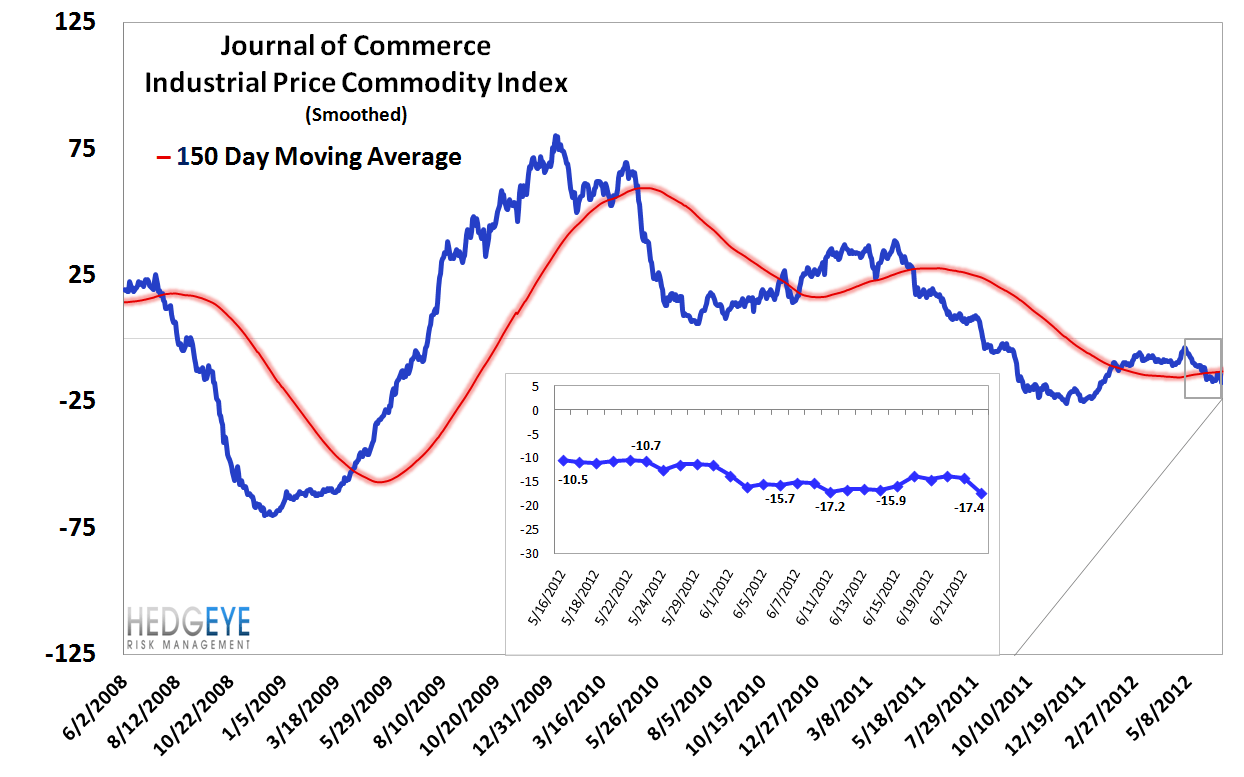
8. Journal of Commerce Commodity Price Index – The JOC index fell 1.5 points, ending the week at -17.41 versus -15.9 the prior week.
9. Euribor-OIS spread – The Euribor-OIS spread (the difference between the euro interbank lending rate and overnight indexed swaps) measures bank counterparty risk in the Eurozone. The OIS is analogous to the effective Fed Funds rate in the United States. Banks lending at the OIS do not swap principal, so counterparty risk in the OIS is minimal. By contrast, the Euribor rate is the rate offered for unsecured interbank lending. Thus, the spread between the two isolates counterparty risk. The Euribor-OIS spread has been moving higher of late for the first time in a long time. It ended the week at 43 bps.

10. ECB Liquidity Recourse to the Deposit Facility – The ECB Liquidity Recourse to the Deposit Facility measures banks’ overnight deposits with the ECB. Taken in conjunction with excess reserves, the ECB deposit facility measures excess liquidity in the Euro banking system. An increase in this metric shows that banks are borrowing from the ECB. In other words, the deposit facility measures one element of the ECB response to the crisis. This data shows through Thursday.

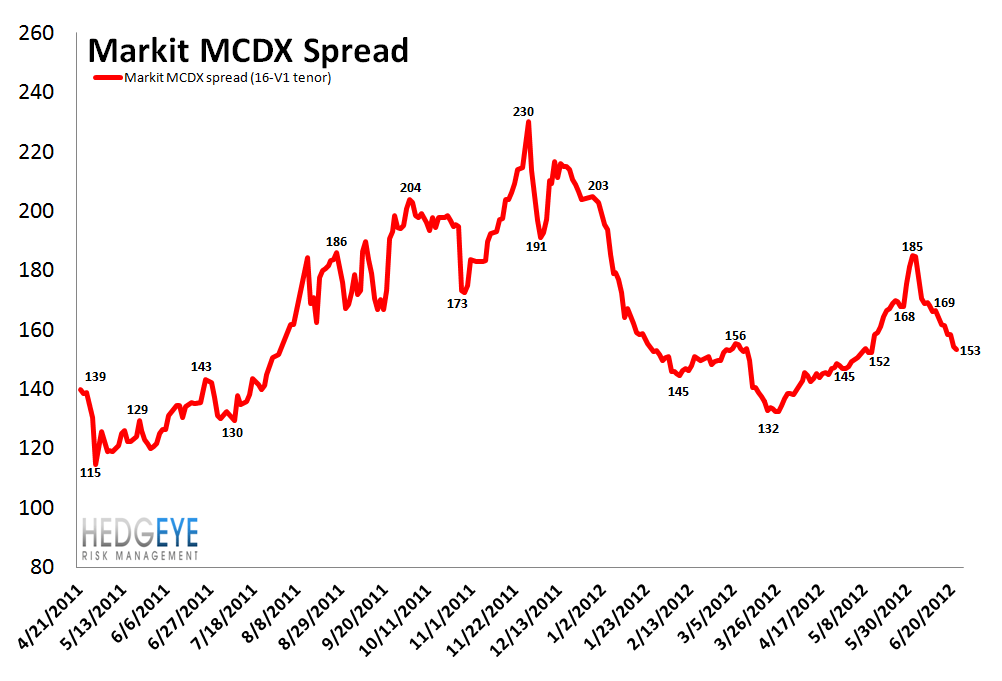
11. Markit MCDX Index Monitor – The Markit MCDX is a measure of municipal credit default swaps. We believe this index is a useful indicator of pressure in state and local governments. Markit publishes index values daily on six 5-year tenor baskets including 50 reference entities each. Each basket includes a diversified pool of revenue and GO bonds from a broad array of states. We track the 16-V1. Last week spreads tightened 8 bps, ending the week at 153 bps versus 161 bps the prior week.
12. Chinese Steel - We use Chinese steel rebar prices to gauge Chinese construction activity, and, by extension, the health of the Chinese economy. We look at the average Chinese rebar spot price. Steel prices in China fell 0.10% last week, or 4 yuan/ton, to 4,075 yuan/ton. Notably, Chinese steel rebar prices have been generally moving lower since August of last year.

13. 2-10 Spread – We track the 2-10 spread as an indicator of bank margin pressure. Last week the 2-10 spread increased by 8 bps to 137 bps.

14. XLF Macro Quantitative Setup – Our Macro team’s quantitative setup in the XLF shows 2.0% upside to TRADE resistance and 2.5% downside to TRADE support.

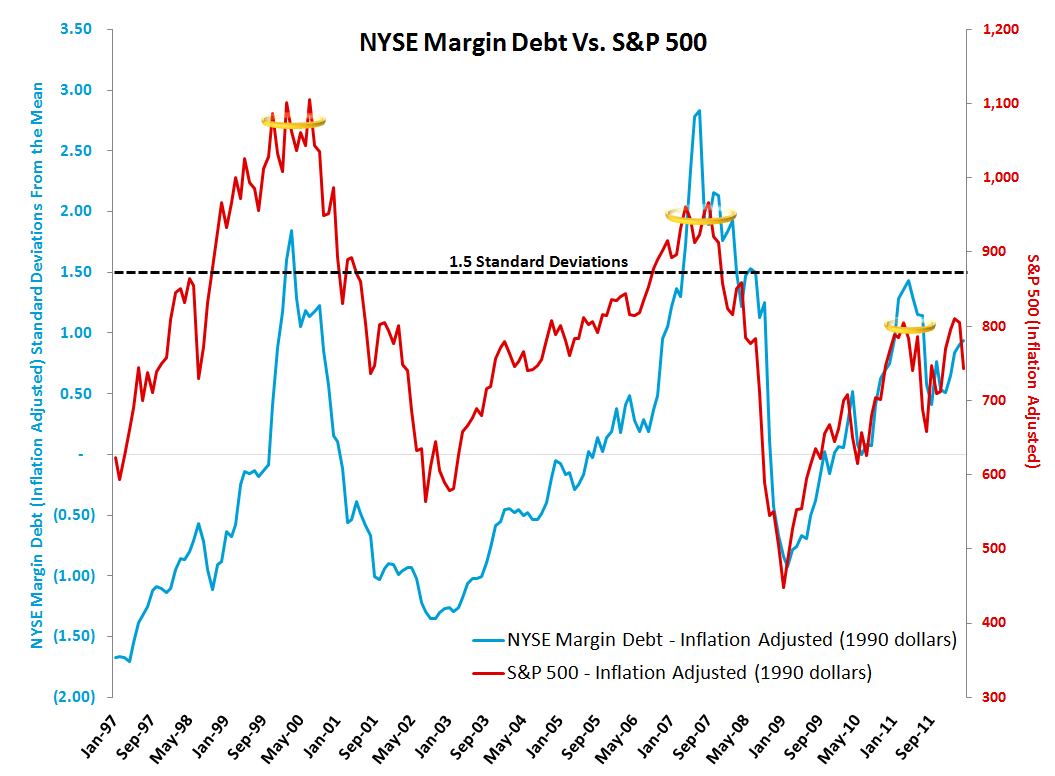
Margin Debt - April: +0.93 standard deviations
We publish NYSE Margin Debt every month when it’s released. NYSE Margin debt hit its post-2007 peak in April of 2011 at $320.7 billion. The chart below shows the S&P 500 overlaid against NYSE margin debt going back to 1997. In this chart both the S&P 500 and margin debt have been inflation adjusted (back to 1990 dollar levels), and we’re showing margin debt levels in standard deviations relative to the mean covering the period 1. While this may sound complicated, the message is really quite simple. First, when margin debt gets to 1.5 standard deviations or greater, as it did last April, it has historically been a signal of extreme risk in the equity market - the last two times it did this the equity market lost half its value in the ensuing period. We flagged this for the first time back in May 2011. The second point is that margin debt trends tend to exhibit high degrees of autocorrelation. In other words, the last few months’ change in margin debt is the best predictor of the change we’ll see in the next few months. We would need to see it approach -0.5 to -1.0 standard deviations before the trend runs its course. There’s plenty of room for short/intermediate term reversals within this broader secular move. Overall, however, this setup represents a long-term headwind for the market. One limitation of this series is that it is reported on a lag.
The chart shows data through April.
Joshua Steiner, CFA
Robert Belsky
Having trouble viewing the charts in this email? Please click the link at the bottom of the note to view in your browser.