This is a company with long term top line tailwinds, easing input costs, and a best-in-class balance sheet operating in an industry that is consolidating. Yesterday, Keith bought Sanderson Farms in the Hedgeye Virtual Portfolio. Favorable supply metrics are driving pricing in the chicken market higher. Corn is also going lower. We’ve seen in the past that these two factors occurring coincidentally tend to drive the stock to outperform the market.
There are seasonal factors to be aware of in terms of how the name trades, but SAFM is a strong trade idea (three weeks or less). We defer to Keith’s quantitative model, but seasonality in the stock suggests that it may be worth keeping this one on a leash that stretches, at most, from here to late-June.
Fundamental Outlook
The key to our call on Sanderson Farms is chicken pricing and the supply dynamics within the chicken processing industry that largely drive that factor. By tracking pullet placements, we can understand the supply cycle within the chicken industry and compare that to the performance of Sanderson Farms’ stock versus the broader equity market. Chicken pricing responds positively to reductions in supply, as the chart below shows. In general, when the chicken supply cycle goes into liquidation – as pullet placements turn negative, prices begin to recover, and the stock recovers along with it. The long term correlation between Sanderson Farms’ stock and Whole Chicken Prices (1995 to present) is 0.91.

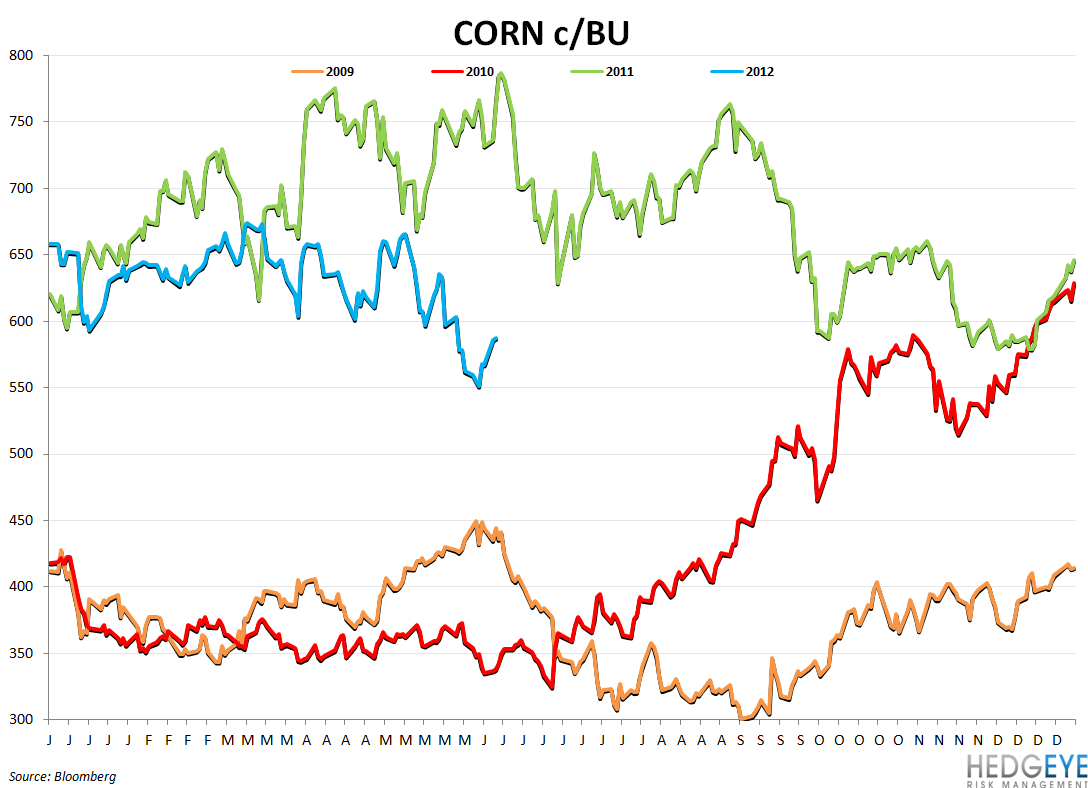
Corn prices are crucial for this company’s margins and the top line benefits of strong chicken pricing are best translated into profit growth when feed costs are favorable. The chart below highlights the year-over-year decline in corn. If the dollar continues to strengthen, corn is likely – at least in the near term – to continue to come down.
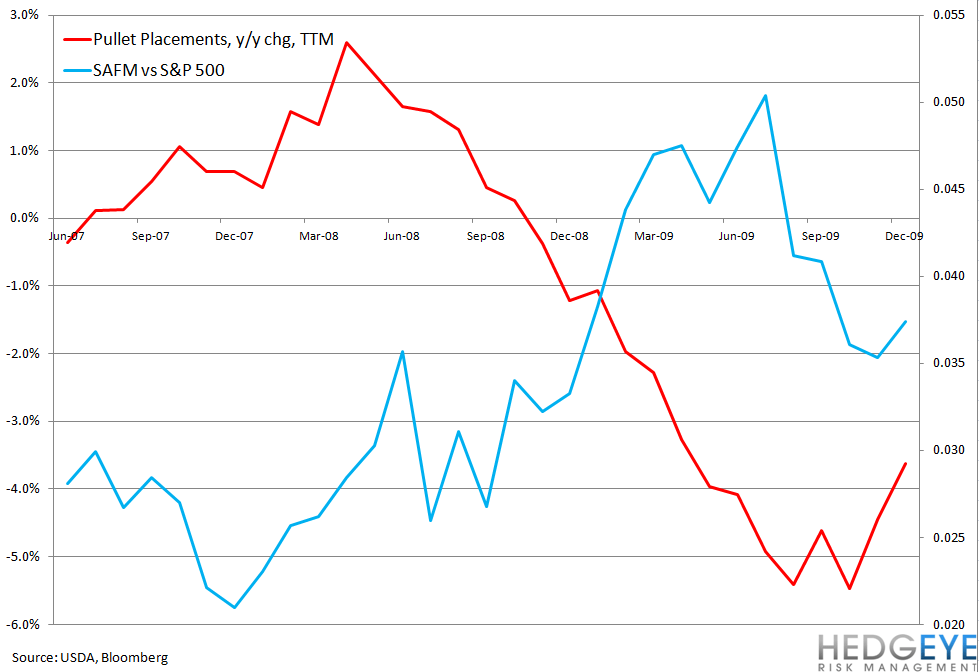
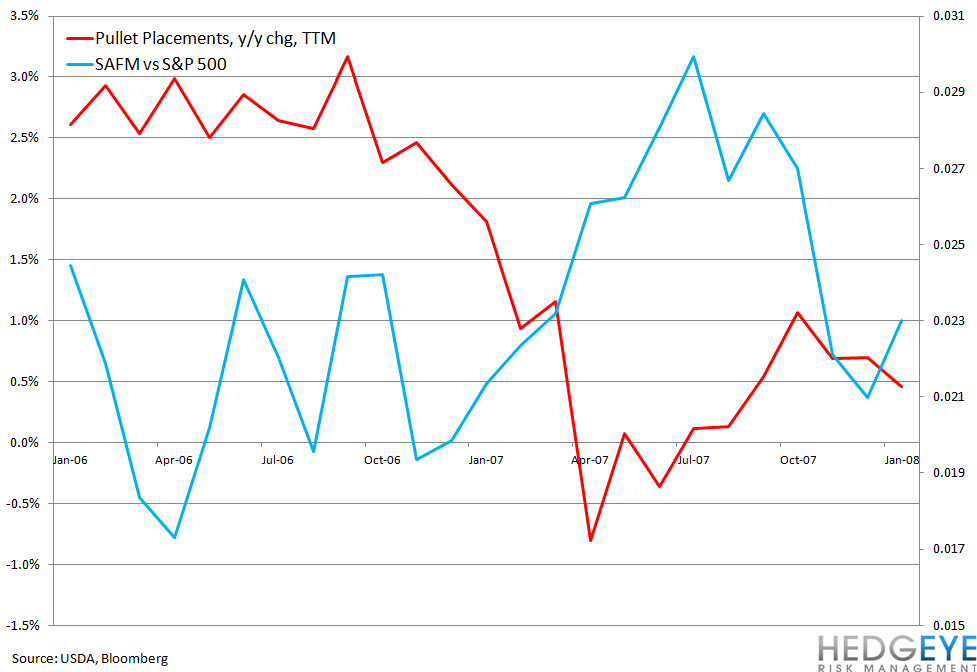
Examining the trend in the annual change in pullet placements, we can break down the longer term cycle versus the relative performance of Sanderson Farms’ stock versus the broader equity market, or S&P 500. As the first chart of this post highlighted, pullet placements declining typically drive higher chicken prices. Historically, the liquidation stage of the chicken supply cycle has proven to be a prescient time to buy Sanderson Farms’ stock. As the charts below indicate, buying SAFM as pullet placements contract can yield significant rewards relative to the S&P 500.


The Tail (three years or less) View
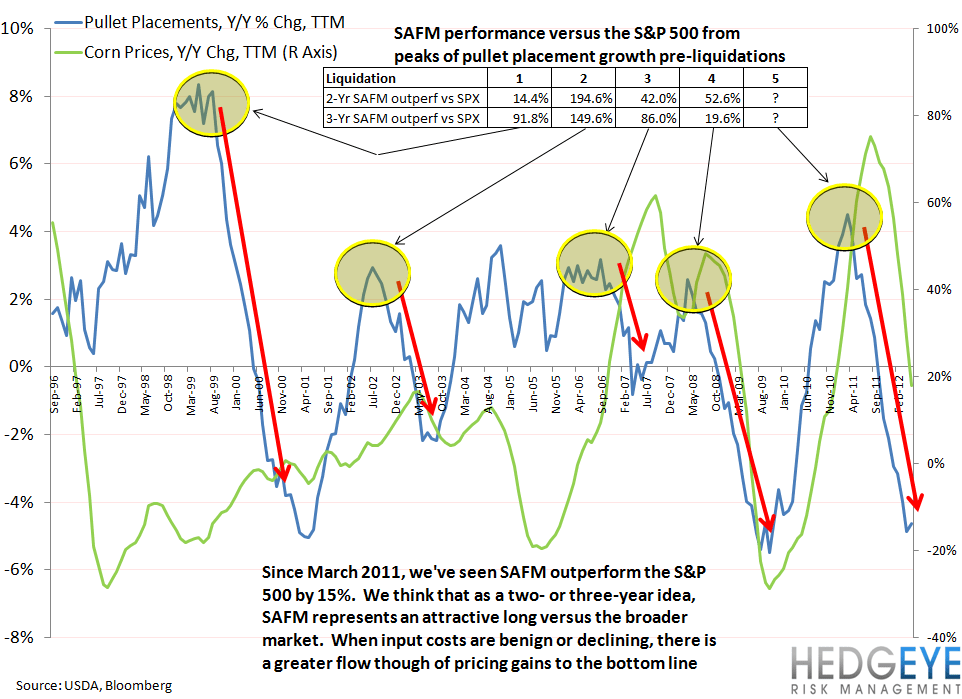
The chart below highlights the potential for Sanderson Farms to outperform the S&P 500 over the next 2-3 years as the impact of supply contraction continues to drive pricing. We have been cautious to tailor our view on Sanderson Farms to fit our macro team’s view on commodities and corn specifically. If corn prices continue to move lower, we expect the benefits of higher chicken pricing to translate to improved earnings and stock price appreciation. The beginnings of the current liquidation cycle has coincided with strong outperformance versus the S&P 500 (March 2011 to present) of 15% but we see further upside given the magnitude of the draw down in chicken supply and the implications of similarly large liquidations historically. A major difference between this liquidation cycle and prior cycles is that it is taking place in the midst of a much weaker economic period than prior cycles. However, we believe that SAFM is a staple, certainly relative to the S&P 500, and expect this name to outperform significantly over the next two-three years.
Quantitative Levels for SAFM

Howard Penney
Managing Director
Rory Green
Analyst
