BBBY’s recent acquisition binge is no coincidence. It’s core business metrics will look very different in the coming three years than they did over the past three.
1) The ‘Amazon Risk’ story is well-telegraphed, but not well-quantified. Here you go…
- Only 1% of BBBY sales come from its e-commerce platform today. That rate has been declining as corporate resources have clearly been focused elsewhere. Unfortunately, e-commerce is something that is nearly impossible to close the gap on competitively without a meaningful capital investment. While not a direct comp, WSM’s omni-channel model boasts e-commerce nearing 40% of sales.
- Demographics are an issue here... A full 65% of those currently using BBBY’s online services are over the age of 35. The younger on-line consumer is going somewhere else. When it comes to e-commerce, the young consumer is the good consumer. Additionally, industry data suggests that BBBY’s online exposure to the 55 & up demographic increased 272bps YoY to ~26% in 2011- bad for online spending. BBBY ranks 9th among the 94 companies we analyzed in terms of leverage to this spending group- WSM is ranked 24th.
- When looking at product overlap between BBBY and AMZN, our in store analysis suggests ~93% of product (exact match or very similar) sold through Bed Bath and Beyond stores can be purchased on Amazon.com.
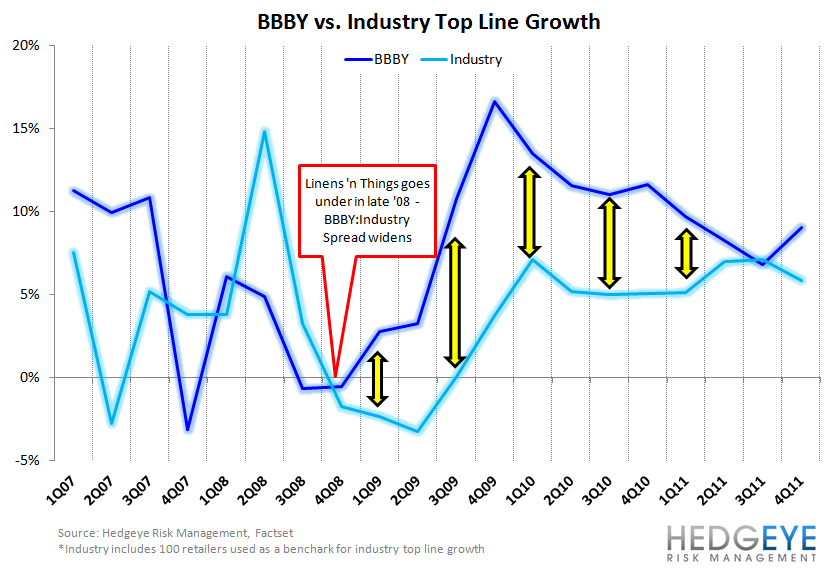
2) It’s base business is a good one, but not as good as some might think. BBBY outcomped the industry by an average of 6 percentage points from 4Q08-2Q11. This is the same time that the company consistently beat quarterly EPS expectations by an average of 20%, and it became known as one of the bullet-proof quality names in retail. It is definitely a quality name. But let’s not forget that this period of outperformance is the precise time it (helped cause and) benefitted from the bankruptcy of Linens n’ Things.